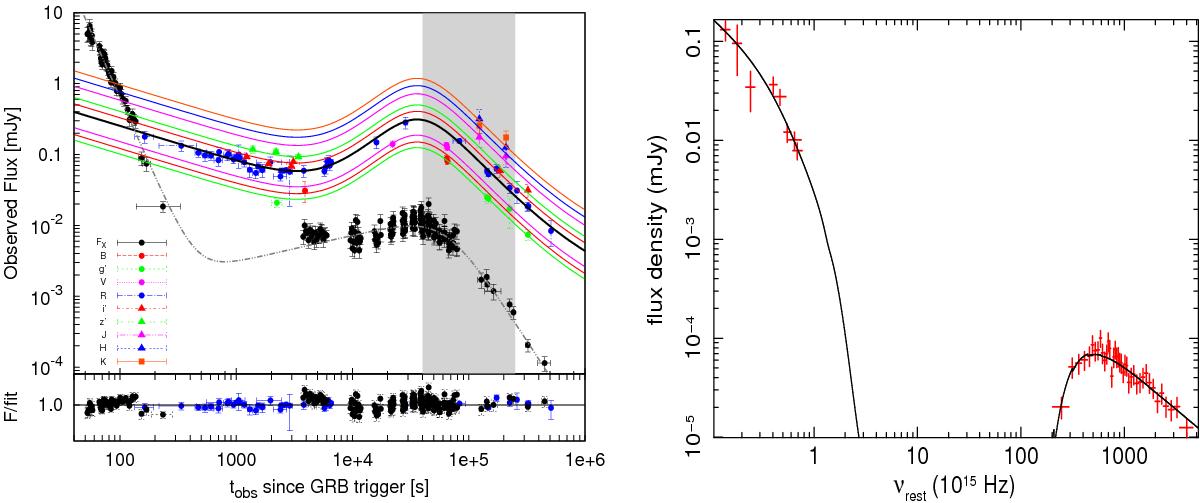
Fig. 1

Left panel: panchromatic light-curve of GRB 120326A in the observer frame. In the X-ray band we draw only the function of the final fit (dot-dashed grey line), while for the optical bands we show the final fit for the R filter (black solid line) and also the re-scaled fit for each wavelength (coloured lines). The scaling factors for different filters are 0.48, 0.4, 0.6, 1.3, 1.6, 2.3, 3.0, and 3.8 for the Bg′Vi′z′JHK bands, respectively. The shaded grey region refers to the time interval during which the XRT spectrum has been extracted. The lower panels show the residuals of the optical and X-ray fits. Right panel: spectral energy distribution at the reference time ![]() = 1 d (see main text for details).
= 1 d (see main text for details).
Current usage metrics show cumulative count of Article Views (full-text article views including HTML views, PDF and ePub downloads, according to the available data) and Abstracts Views on Vision4Press platform.
Data correspond to usage on the plateform after 2015. The current usage metrics is available 48-96 hours after online publication and is updated daily on week days.
Initial download of the metrics may take a while.


