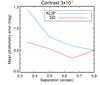
Fig. 8
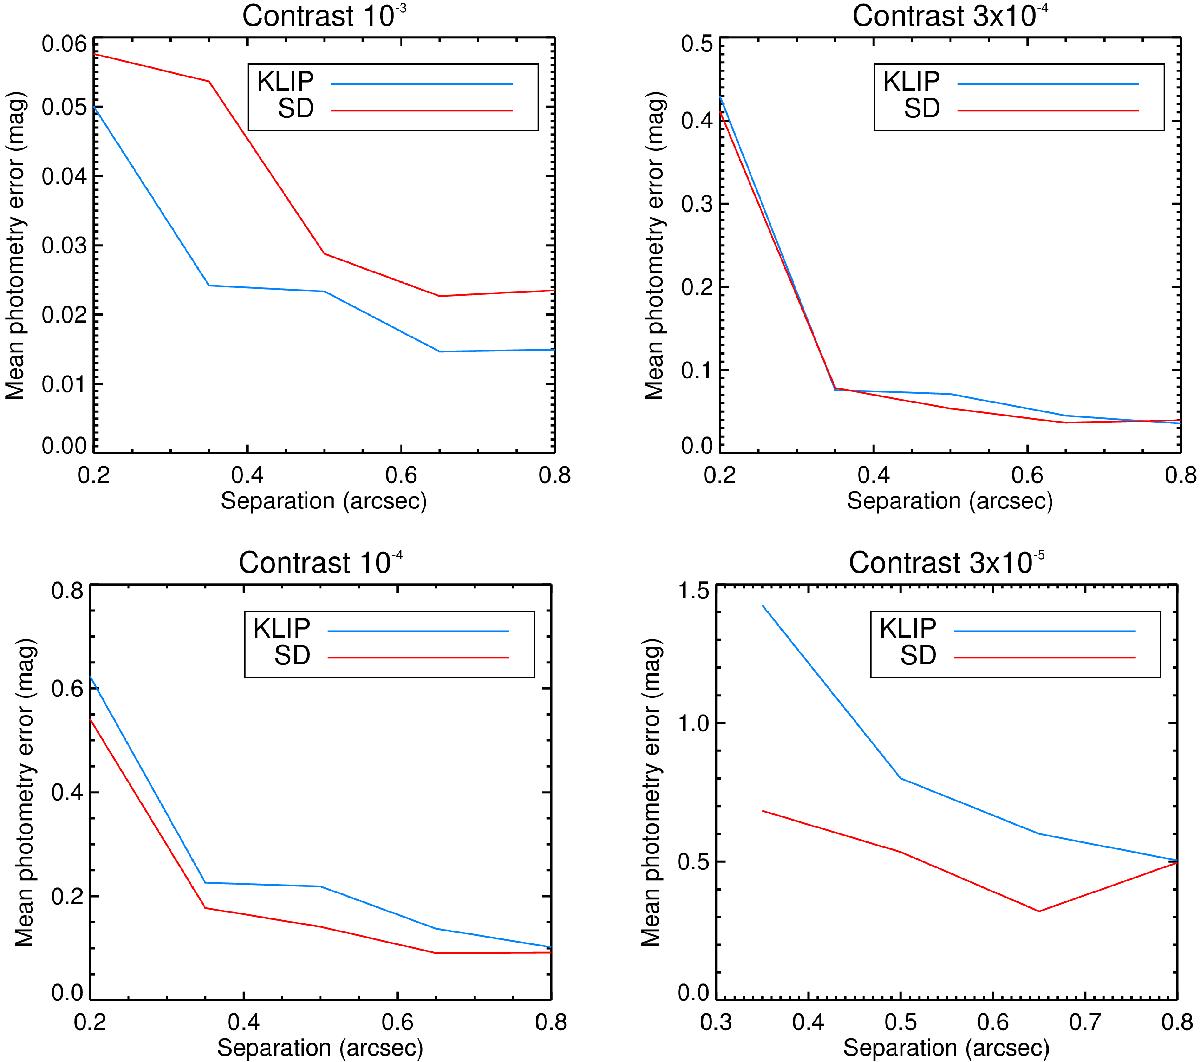
Expected photometric errors for different contrasts as a function of separation from the central star. Results obtained with KLIP (red line) and SD (blue line) are compared. Each point represents the median of the errorbar on the 39 IFS channels. Only detected planets are considered in this analysis. Very few planets with contrast of 10-5 are detected, as shown in Table 3, so the corresponding plot is not shown.
Current usage metrics show cumulative count of Article Views (full-text article views including HTML views, PDF and ePub downloads, according to the available data) and Abstracts Views on Vision4Press platform.
Data correspond to usage on the plateform after 2015. The current usage metrics is available 48-96 hours after online publication and is updated daily on week days.
Initial download of the metrics may take a while.