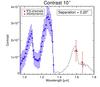
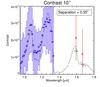
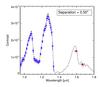
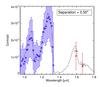
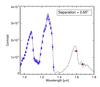
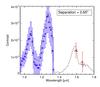
Fig. 6
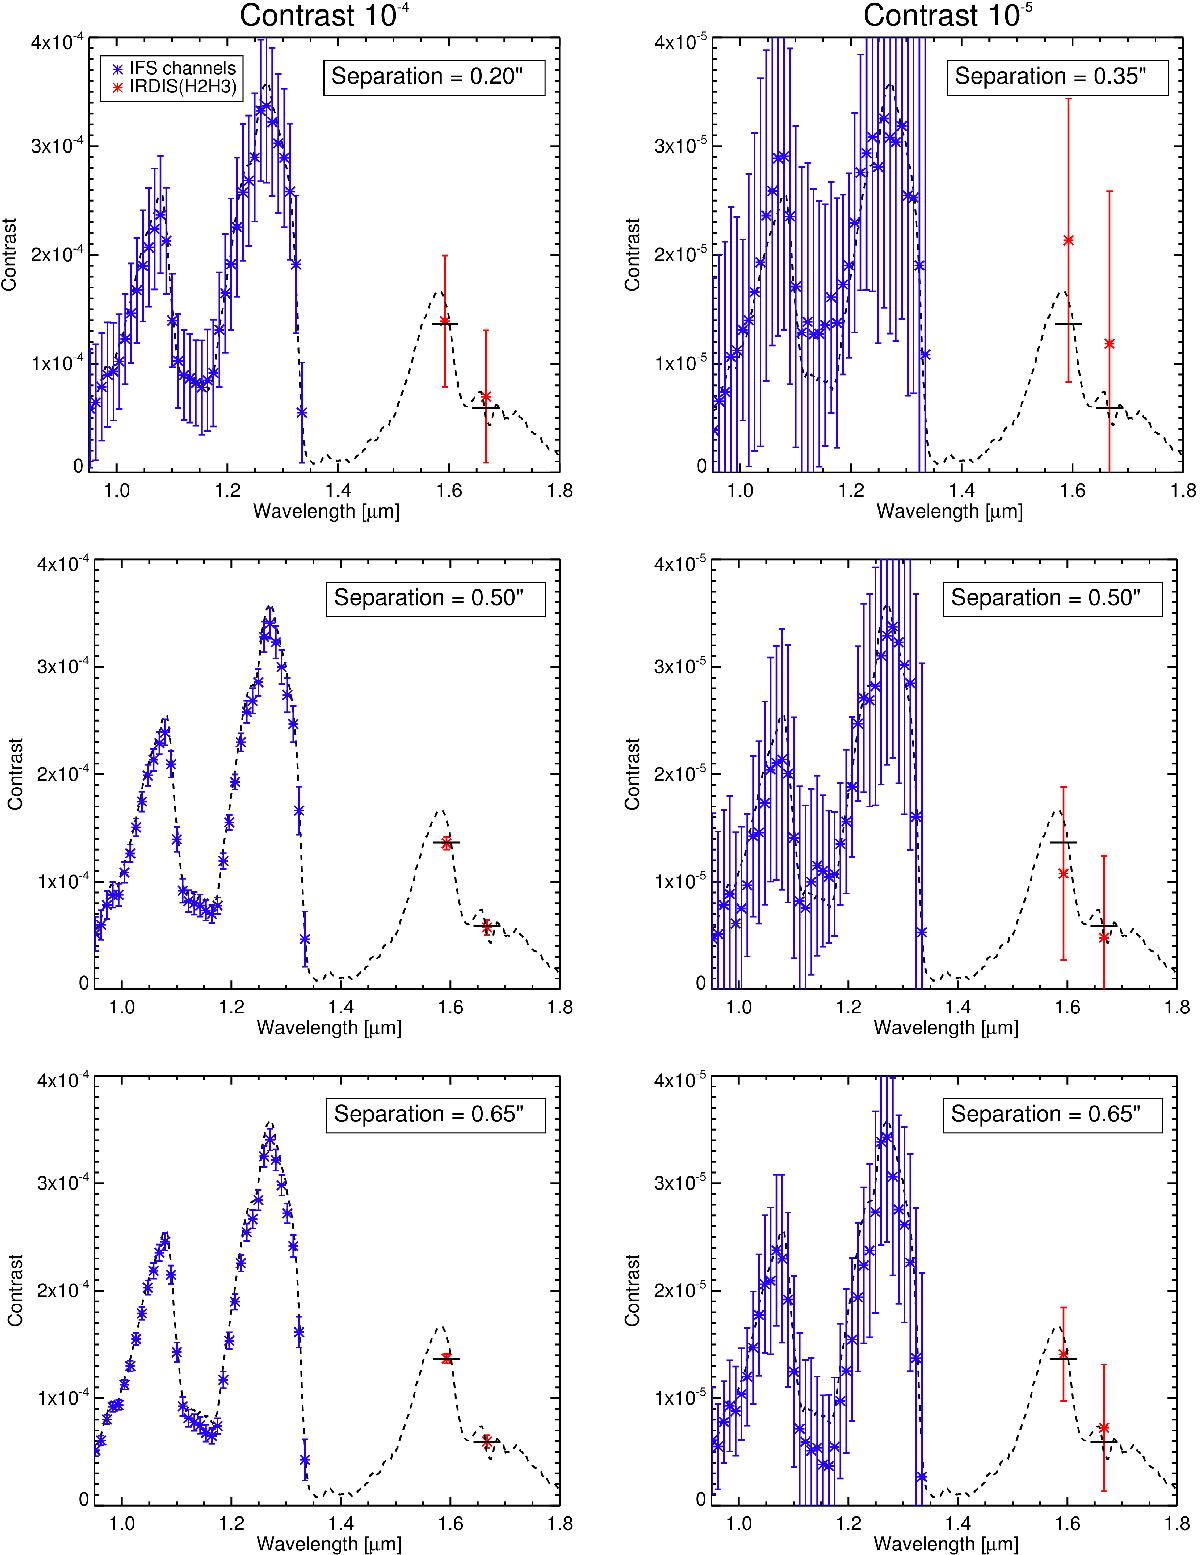
Spectral extraction of a T5 (T ~ 1100 K) model spectrum (black line) for planets at different separations (from top to bottom) and contrast from the star (10-4 on the left, 10-5 on the right). The blue points represent the IFS photometry for each channel (reduced with the SD technique), while the red ones represent the flux measurement in the two IRDIS filters H2 and H3. For IRDIS data, the black horizontal line represents the therotical value of the photometry; each line covers the bandpass of the filters.
Current usage metrics show cumulative count of Article Views (full-text article views including HTML views, PDF and ePub downloads, according to the available data) and Abstracts Views on Vision4Press platform.
Data correspond to usage on the plateform after 2015. The current usage metrics is available 48-96 hours after online publication and is updated daily on week days.
Initial download of the metrics may take a while.