Fig. 8
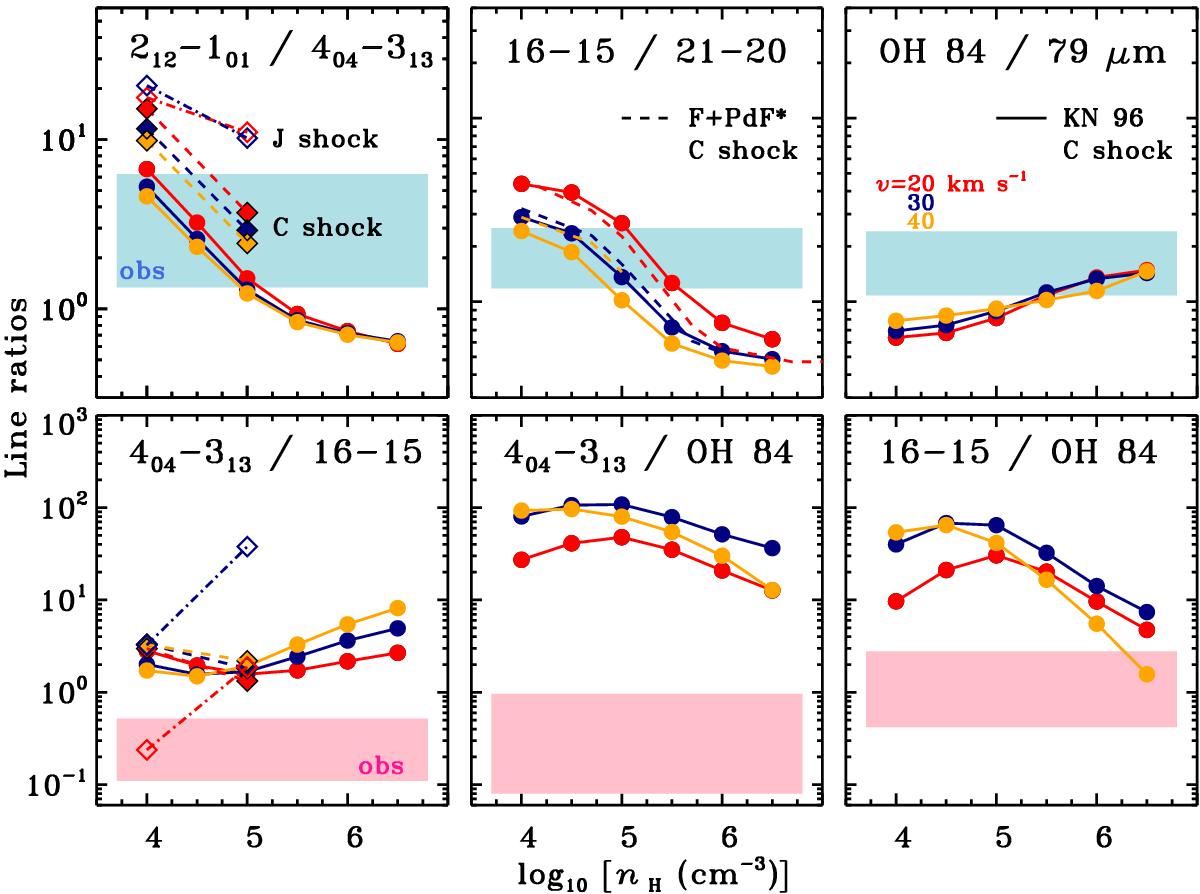
Ratios of line fluxes in units of erg cm-2 s-1 as a function of logarithm of density of the pre-shock gas, nH. Ratios of different transitions of the same molecules are shown at the top row and line ratios comparing different species are shown at the bottom. Filled symbols and full lines show models of C shocks (circles – from Kaufman & Neufeld, diamonds – from Flower & Pineau des Forêts), whereas the empty symbols and dash-dotted lines show models of J shocks (Flower & Pineau des Forêts 2010). Colors distinguish shock velocities: 20 km s-1 shocks are shown in red, 30 km s-1 in blue, and 40 km s-1 in orange.
Current usage metrics show cumulative count of Article Views (full-text article views including HTML views, PDF and ePub downloads, according to the available data) and Abstracts Views on Vision4Press platform.
Data correspond to usage on the plateform after 2015. The current usage metrics is available 48-96 hours after online publication and is updated daily on week days.
Initial download of the metrics may take a while.