Fig. 7
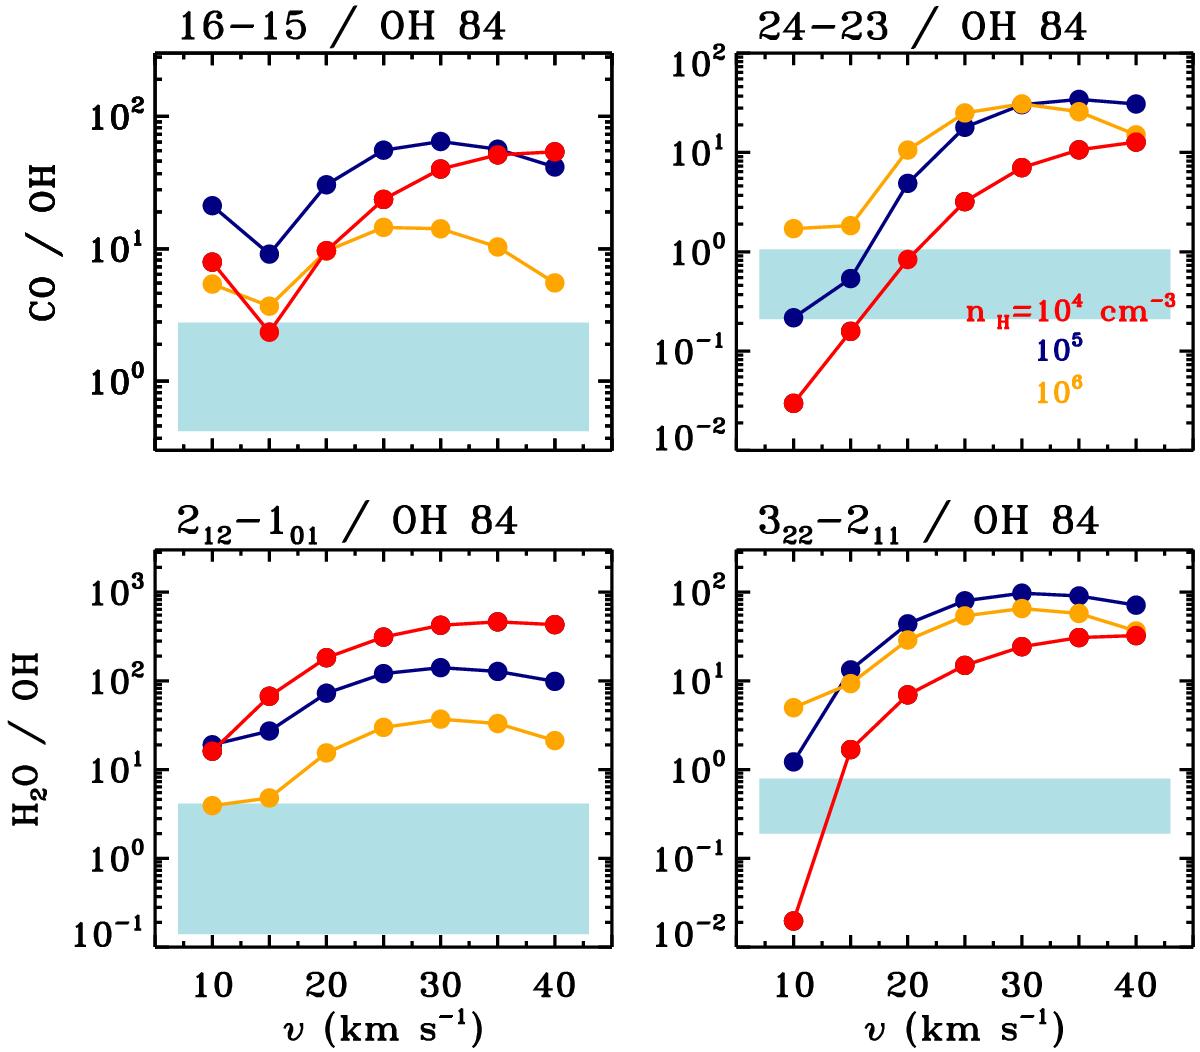
CO to OH and H2O to OH line ratios as a function of shock velocities using KN96. The ratios are shown for pre-shock densities of 104 cm-3 (red), 105 cm-3 (blue), and 106 cm-3 (yellow). The range of line ratios from observations is shown as filled rectangles.
Current usage metrics show cumulative count of Article Views (full-text article views including HTML views, PDF and ePub downloads, according to the available data) and Abstracts Views on Vision4Press platform.
Data correspond to usage on the plateform after 2015. The current usage metrics is available 48-96 hours after online publication and is updated daily on week days.
Initial download of the metrics may take a while.