Fig. 5
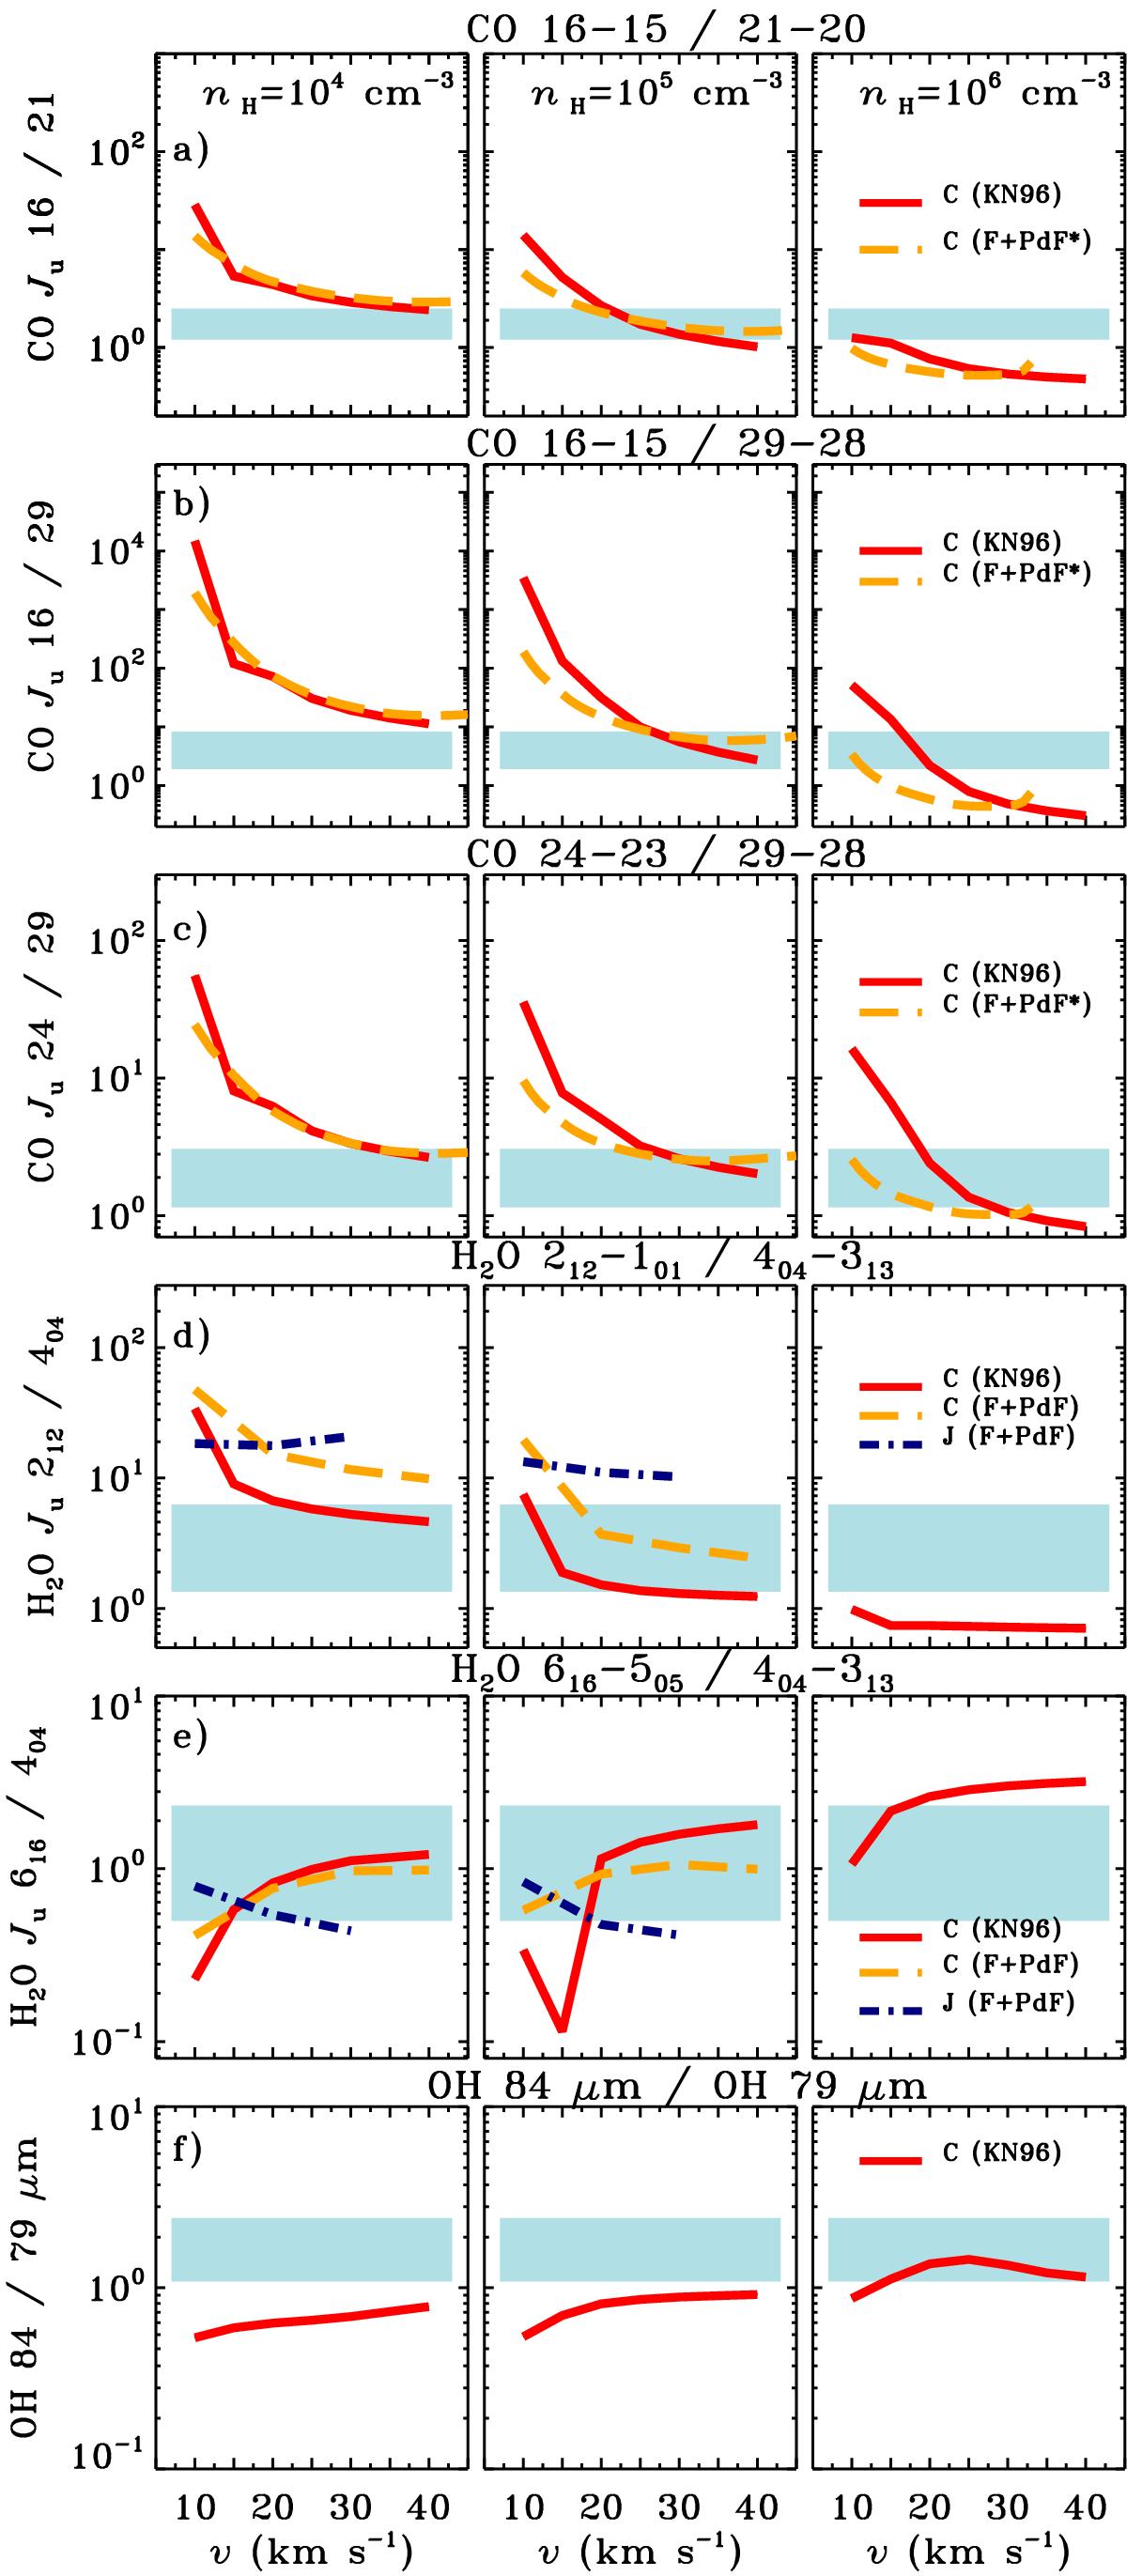
Line ratios of the same species using Kaufman & Neufeld (1996) C shock models (KN96, solid line) and Flower & Pineau des Forêts (2010) C and J shock models (F+PdF, dashed and dashed-dotted lines, respectively). Ratios are shown as a function of shock velocity and for pre-shock densities of 104 cm-3 (left), 105 cm-3 (center), and 106 cm-3 (right). Observed ratios are shown as blue rectangles.
Current usage metrics show cumulative count of Article Views (full-text article views including HTML views, PDF and ePub downloads, according to the available data) and Abstracts Views on Vision4Press platform.
Data correspond to usage on the plateform after 2015. The current usage metrics is available 48-96 hours after online publication and is updated daily on week days.
Initial download of the metrics may take a while.