Fig. 3
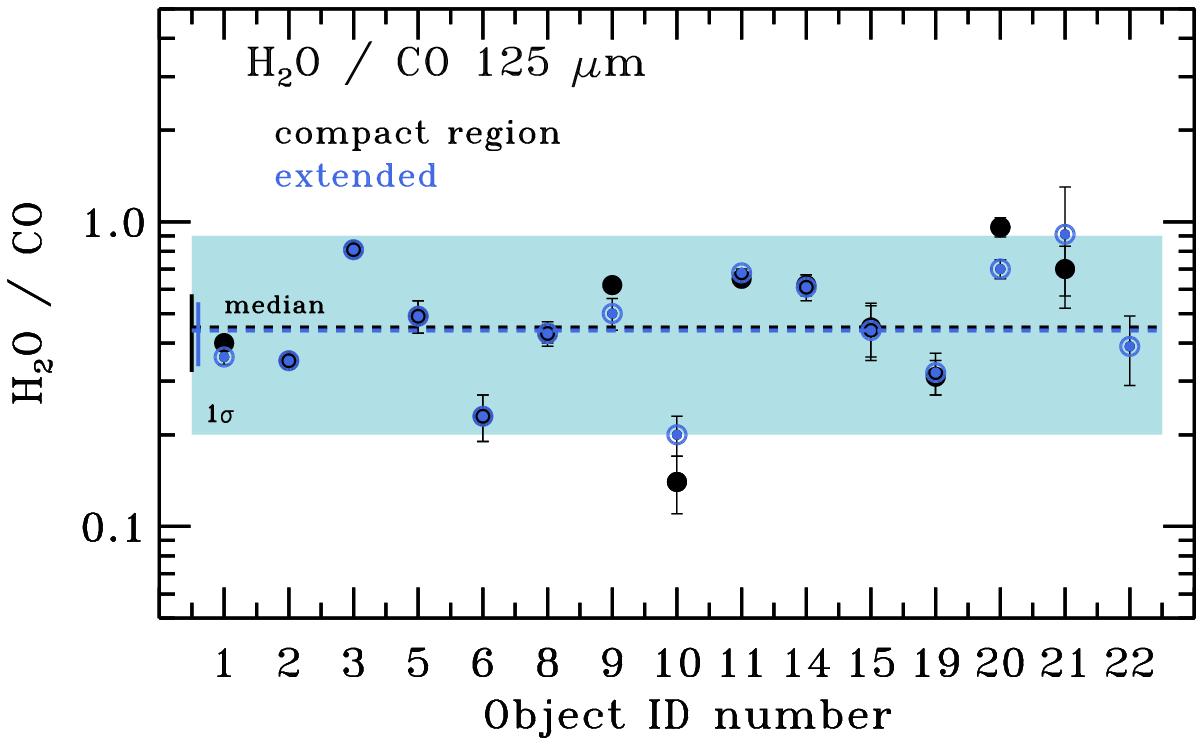
Flux ratios of the H2O 404−313 and CO 21−20 lines at ~125 μm calculated using compact and extended flux extraction regions (see text) corrected for contamination from other sources/outflows. Median values for the two configurations are shown by the dashed line. The light blue rectangle shows the parameter space between the minimum and maximum values of line ratios in the more extended configuration. The error bars reflect the uncertainties in the measured fluxes of the two lines, excluding the calibration error, which is the same for those closely spaced lines.
Current usage metrics show cumulative count of Article Views (full-text article views including HTML views, PDF and ePub downloads, according to the available data) and Abstracts Views on Vision4Press platform.
Data correspond to usage on the plateform after 2015. The current usage metrics is available 48-96 hours after online publication and is updated daily on week days.
Initial download of the metrics may take a while.