Fig. 1
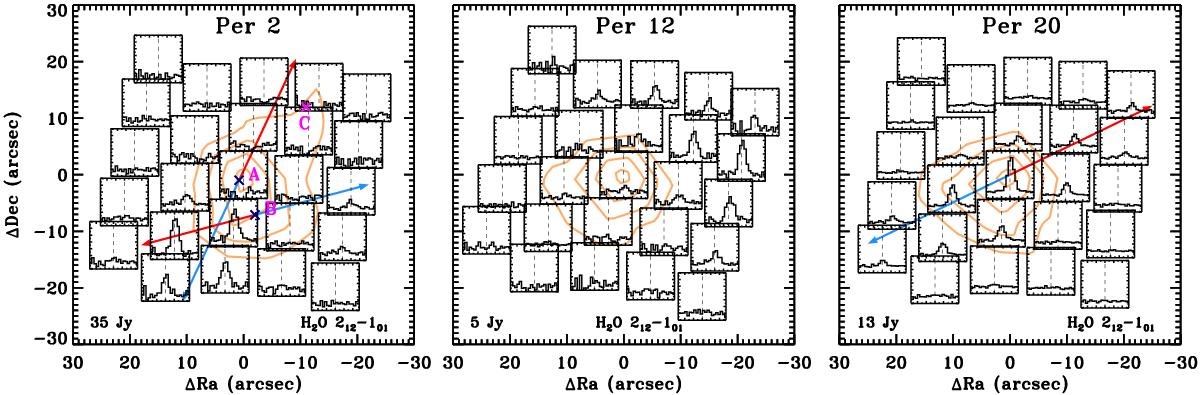
PACS spectral maps in the H2O 212−101 line at 179 μm illustrating sources with extended emission due to multiple sources in one field (Per 2), contamination by the outflow driven by another source (Per 12), and associated with the targeted protostar (Per 20). Even though the emission on the maps seems to be extended in many sources in Perseus, the extended emission associated with the targeted protostar itself is detected only towards a few of them (see Table 2). The orange contours show continuum emission at 30%, 50%, 70%, and 90% of the peak value written in the bottom left corner of each map. L1448 IRS 3A, 3B, and 3C sources and their CO 2−1 outflow directions are shown on the map of Per 2 (Kwon et al. 2006; Looney et al. 2000); the blue outflow lobe of L1448-MM also covers much of the observed field. CO 2−1 outflow directions of Per 20/HH211 are taken from Gueth & Guilloteau (1999). Wavelengths in microns are translated to the velocity scale on the X-axis using laboratory wavelengths (see Table A.1) of the species and cover the range from − 600 to 600 km s-1. The Y-axis shows fluxes in Jy normalized to the spaxel with the brightest line on the map in a range − 0.2 to 1.2.
Current usage metrics show cumulative count of Article Views (full-text article views including HTML views, PDF and ePub downloads, according to the available data) and Abstracts Views on Vision4Press platform.
Data correspond to usage on the plateform after 2015. The current usage metrics is available 48-96 hours after online publication and is updated daily on week days.
Initial download of the metrics may take a while.