| Issue |
A&A
Volume 572, December 2014
|
|
|---|---|---|
| Article Number | A32 | |
| Number of page(s) | 7 | |
| Section | Astronomical instrumentation | |
| DOI | https://doi.org/10.1051/0004-6361/201424133 | |
| Published online | 25 November 2014 | |
Compensation of high-order quasi-static aberrations on SPHERE with the coronagraphic phase diversity (COFFEE)
1
Onera – The French Aerospace Lab,
92322
Châtillon,
France
e-mail:
This email address is being protected from spambots. You need JavaScript enabled to view it.
2
Aix-Marseille Université, CNRS, LAM (Laboratoire d’Astrophysique
de Marseille) UMR 7326, 13388
Marseille,
France
3
Institut de Planétologie et d’Astrophysique de Grenoble
(IPAG), BP 53,
38041
Grenoble Cedex 9,
France
4
Groupement d’intérêt scientifique PHASE (Partenariat Haute
résolution Angulaire Sol et Espace) between Onera, Observatoire de Paris, CNRS,
Université Diderot, Laboratoire d’Astrophysique de Marseille and Institut de
Planétologie et d’Astrophysique de
Grenoble, France
Received: 5 May 2014
Accepted: 13 August 2014
Abstract
Context. The second-generation instrument SPHERE, dedicated to high-contrast imaging, will soon be in operation on the European Very Large Telescope. Such an instrument relies on an extreme adaptive optics system coupled with a coronagraph that suppresses most of the diffracted stellar light. However, the coronagraph performance is strongly limited by quasi-static aberrations that create long-lived speckles in the scientific image plane, which can easily be mistaken for planets.
Aims. The wavefront analysis performed by SPHERE’s adaptive optics system uses a dedicated wavefront sensor. The ultimate performance is thus limited by the unavoidable differential aberrations between the wavefront sensor and the scientific camera, which have to be estimated and compensated for. In this paper, we use the COFFEE approach to measure and compensate for SPHERE’s quasi-static aberrations.
Methods. COronagraphic Focal-plane waveFront Estimation for Exoplanet detection (COFFEE), which consists in an extension of phase diversity to coronagraphic imaging, estimates the quasi-static aberrations, including the differential ones, using only two focal plane images recorded by the scientific camera. In this paper, we use coronagraphic images recorded from SPHERE’s infrared detector IRDIS to estimate the aberrations upstream of the coronagraph, which are then compensated for using SPHERE’s extreme adaptive optics loop SAXO.
Results. We first validate the ability of COFFEE to estimate high-order aberrations by estimating a calibrated influence function pattern introduced upstream of the coronagraph. We then use COFFEE in an original iterative compensation process to compensate for the estimated aberrations, leading to a contrast improvement by a factor that varies from 1.4 to 4.7 between 2λ/D and 15λ/D on IRDIS. The performance of the compensation process is also evaluated through simulations. An excellent match between experimental results and these simulations is found.
Key words: instrumentation: adaptive optics / instrumentation: high angular resolution / techniques: image processing / telescopes / methods: numerical
© ESO, 2014
1. Introduction
Exoplanet imaging is one of the most challenging areas of today’s astronomy. Such observations, which until now have only been possible for planets with high masses or wide apparent distances from their host star (Kalas et al. 2008; Marois et al. 2008; Lagrange et al. 2009), can provide information on both the chemical composition of their atmospheres and their temperatures. The upcoming ground-based instruments dedicated to exoplanet direct imaging, such as SPHERE on the VLT (Beuzit et al. 2007) or GPI on Gemini South (Macintosh et al. 2008), will soon be in operation, providing original data for comparative exoplanetary science to the community. These instruments rely on extreme adaptive optics (XAO) systems to ensure a high angular resolution (0.1′′−0.1′) coupled with coronagraphs to reach the required contrast (106−107) on the scientific detector. The ultimate limitation of these current and future systems lies in quasi-static aberrations upstream of the coronagraph, which originate in optical misalignment or surface polishing errors (Dohlen et al. 2011; Hugot et al. 2012). These aberrations give birth to long-lived speckles on the detector, which strongly limit the achievable contrast, since they can easily be mistaken for a planet. Thus, being able to reach the ultimate performance of high-contrast imaging systems means estimating and compensating for these aberrations. The most accurate measurement of these aberrations can be performed using focal plane wavefront sensors, which are not limited by non-common path aberrations (NCPA) since they perform the estimation using data recorded from the scientific camera itself.
SPHERE’s baseline currently relies on a differential estimation performed with phase diversity (Mugnier et al. 2006; Sauvage et al. 2012a), a focal plane wavefront sensing technique that uses classical imaging (no coronagraph). However, this wavefront sensor is limited to the estimation of aberrations up to eight cycles per pupil, which correspond to speckles close to the optical axis (up to a field angle of 8λ/D), whereas the SPHERE XAO system (SAXO) could compensate for up to 20 cycles per pupil. Besides, since such a measurement requires removing the coronagraph, it does not allow proper compensation of tip, tilt, and defocus aberrations, which code for positioning errors of the star with respect to the coronagraphic mask.
An optimization of SPHERE’s baseline for quasi-static speckle compensation will thus consist in a focal plane wavefront sensor that retrieves the aberrations from coronagraphic images, which would allow one to measure high-order aberrations without removing the coronagraph. Several techniques dedicated to this goal have been proposed, which all assume small aberrations: the Self-Coherent Camera (SCC; Baudoz et al. 2006), which relies on a modification of the imaging system, needs only one image to perform the estimation, whereas the Electric Field Conjugation (EFC; Give’on et al. 2007) requires at least three images to retrieve the aberrations but without any modification of the optical system.
Our focal plane wavefront sensor, COronagraphic Focal-plane wavefront Estimation for Exoplanet detection (COFFEE), consists in a coronagraphic extension of phase diversity (Sauvage et al. 2012b; Paul et al. 2013b) that estimates the aberrations both upstream and downstream of the coronagraph using two coronagraphic focal plane images. In this paper, we present the application of the recent high-order myopic extension of this sensor presented in Paul et al. (2013a) to the SPHERE instrument during its final integration phase at IPAG (Institut de Planétologie et d’Astrophysique de Grenoble). The framework of COFFEE’s application to SPHERE is described in Sect. 2. Section 3 demonstrates the ability of COFFEE to estimate high-order aberrations with nanometric precision from experimental focal plane coronagraphic images. Then, Sect. 4 presents SPHERE’s contrast optimization (up to 18λ/D) on the detector by compensating for the aberrations (including the high-order ones) using COFFEE’s estimation. Section 5 concludes this paper.
2. Application of COFFEE to SPHERE
COFFEE requires only two images  and
and  recorded on the detector that differ by a known aberration φdiv to estimate aberrations both upstream (φu) and downstream (φd) of the coronagraph. In this paper, we consider the SPHERE instrument calibration, performed at a high signal-to-noise ratio with a monochromatic source emitted from a single-mode laser fiber. Because it is very small in such a calibration case, the residual turbulence is therefore neglected in the sequel. We use the following coronagraphic imaging model:
 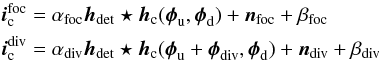 (1)where αp is the incoming flux (p stands for “foc” or “div”), hc the coronagraphic “point spread function” (PSF) of the instrument (which depends on φu and φd, and whose expression is explained in Paul et al. 2013a), hdet the known detector PSF, nfoc and ndiv are the measurement noises that comprise both detector and photon noises, βp is a unknown uniform background (offset), and ⋆ denotes the discrete convolution operation. COFFEE estimates the aberrations φu and φd, as well as the fluxes α = [ αfoc,αdiv ] and the backgrounds β = [ βfoc,βdiv ] that minimize the maximum a posteriori (MAP) criterion J(α,β,φu,φd) whose expression is given hereinafter.
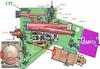 |
Fig. 1 Schematic representation of SPHERE. To apply COFFEE on this instrument, coronagraphic images were recorded from the IRDIS detector. |
The SPHERE system is represented in Fig. 1. To use COFFEE on this instrument, coronagraphic images are recorded by the infrared camera IRDIS (infrared dual imaging spectrograph) using an apodized Lyot coronagraph (ALC), whose apodizer is presented on Fig. 2 (left), and an obscurated (15%) Lyot Stop pupil whose transmission is presented on Fig. 2 (right) as well. All the parameters used for coronagraphic image acquisitions are gathered in Table 1. The SPHERE XAO loop SAXO will be described in Sect. 4.1.
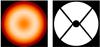 |
Fig. 2 Experimental images of SPHERE’s entrance pupil apodizer (left) and of the Lyot Stop pupil transmission (right). |
Parameters used to apply COFFEE on SPHERE.
It is worth mentioning that several “dead” pixels can be found on the IRDIS CCD detector (around 1% per image). Such pixels, whose value is notably high, could strongly limit COFFEE’s accuracy by introducing a bias in criterion J’s value. Thus, to improve COFFEE’s accuracy, these pixels are detected in each recorded image prior to the phase estimation and taken into account by modifying criterion J’s expression given in Paul et al. (2013a) as follows:  (2)where ∥x∥2 denotes the sum of squared pixel values of map x. Here,
  and
and  are “weight” maps defined as
  if the pixel is detected as dead and
  otherwise, where
  is the noise variance in the image. Thus, by setting an infinite variance on this pixel (i.e.
  ), dead pixels no longer have an impact on the criterion value, and thus on COFFEE’s estimation.
As explained in Paul et al. (2013a), regularization metrics ℛ(φk) (where k stands for u (upstream) or d (downstream)) used in criterion J (Eq. (2)) are based on the available a priori knowledge on the SPHERE quasi-static aberration’s power spectral density (PSD), which follows a 1 /ν2 scaling law, where ν is the spatial frequency (Dohlen et al. 2011; Hugot et al. 2012). These metrics are given by 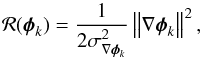 (3)where ∇ represents the gradient operator, and
  the variance of ∇φk, which can be computed from the aberration’s PSD and the rms value of the wavefront error (WFE).
The diversity phase φdiv used to record the diversity image , introduced using SAXO, is composed of defocus alone (φdiv = adivZ4). The amplitude adiv has been chosen following Paul et al. (2013a) where it has been demonstrated that if a pure defocus is used as diversity phase, its amplitude should be 2.5 times greater than the WFE of the aberration upstream of the coronagraph for an optimal estimation. Knowing from SPHERE’s baseline phase diversity measurement that the WFE upstream of the coronagraph is approximately 40 nm rms (0.16 rad rms), we use adiv = 101 nm rms (0.4 rad rms).
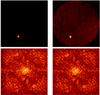 |
Fig. 3 High-order aberration (poke) estimation on SPHERE with COFFEE. Top: introduced poke (left, ϵ = 144 nm PV) and COFFEE-estimated poke (right, ϵest = 147 nm PV). Bottom: experimental image recorded from IRDIS (left) and image computed using the reconstructed aberration (right) (log. scale, same range for both images). |
3. High-order aberration estimation
We first validate COFFEE on SPHERE by estimating a high-order calibrated aberration introduced upstream of the coronagraph. First, focused and diversity images are recorded from IRDIS, allowing COFFEE to estimate SPHERE’s aberrations  . Then, by pushing on a single actuator (amplitude ϵcal = 144 nm PV) of SAXO’s high-order deformable mirror (HODM), we introduce the corresponding influence function pattern (called hereafter a poke) upstream of the coronagraph. This poke pattern is represented in the top left of Fig. 3. Focused and diversity coronagraphic images are recorded from IRDIS and then processed by COFFEE, which estimates an aberration
  upstream of the coronagraph. Then, the difference
  gives the poke estimated by COFFEE. As one can see at the top of Fig. 3, COFFEE’s estimated poke is very close to the introduced one: the difference between the two is 3 nm PV. This results, in turn, in a very good match between the experimental images and the ones computed for the estimated aberrations (Fig. 3, bottom). From COFFEE’s estimation (Fig. 3, top right), one can notice, apart from the poke, a residual high-frequency aberration whose amplitude is 6.82 nm rms, representing 5% of the poke value. Its origin lies in a combination of several terms, including internal turbulence, DM crosstalk, and computational effects.
4. Contrast optimization on IRDIS: quasi-static aberration compensation with COFFEE
In this section, we propose a refined process for the compensation of SPHERE’s quasi static aberrations using the phase map estimated by COFFEE. Section 4.1 presents the application of the pseudo-closed loop (PCL) process proposed in Paul et al. (2013b) to SPHERE, which is then used in Sect. 4.2 to optimize the contrast on IRDIS. The obtained performance of the PCL is then discussed in Sect. 4.3 and cross-validated using simulations. Last, in Sect. 4.4, we analyze the aberrations upstream of the coronagraph estimated by COFFEE before and after compensation.
4.1. Projection of the estimated aberrations on SAXO’s reference slopes
After their estimation, the aberrations upstream of the coronagraph  are transformed into a set of slopes that will then be used to modify SAXO’s references slopes sref, following the PCL process described in Paul et al. (2013b).
We let F be the HODM calibrated influence matrix; any HODM introduced aberration can be described as a set of 1377 actuator voltages vcorr. We are thus looking for the set vcorr that solves the least-squares problem: 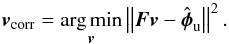 (4)The solution of this problem can be written as
  (5)with T the generalized inverse of matrix F.
Using the calibrated Shack-Hartmann wavefront interaction matrix D, we can compute the corresponding set of slopes scorr = Dvcorr. Thus, the simplest way to compensate for the aberration φu upstream of the coronagraph would consist in introducing the estimated aberration with SAXO by modifying the references slopes sref of the wavefront sensor, 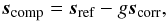 (6)where g is the PCL gain and scomp are SAXO’s updated references slopes.
We then denote by C the SAXO matrix that controls the HODM by computing, from the slopes scomp, the corresponding set of voltages vcomp = Cscomp. The conventional way to obtain this matrix is to compute it as the generalized inverse of D. Various modal bases can be used to control the HODM. The simplest one corresponds to the eigen modes of the system, computed from D’s inversion. SAXO’s robustness can be improved by truncating the control basis, which is conventionally performed by filtering out the modes that correspond to low eigenvalues from the basis. However, Petit et al. (2008) demonstrate that because of the large number of HODM actuators, some of these low eigenvalues correspond, in the case of SAXO, to high-energy modes whose truncation from the control basis would lead to a significant performance decrease.
Thus, Petit et al. (2008) have determined that an optimized control of the HODM can be performed with a Karhunen-Loeve (KL) control basis computed on the space defined by the HODM influence functions. The 1377 KL modes of this basis, naturally ordered according to the propagated turbulent energy, allow a proper control basis truncation. In SAXO’s case, a robust and efficient control of the HODM can be achieved using a 999 modes control basis. It is worth mentioning that such a basis takes the HODM actuators into account that cannot be controlled by the loop, either because they will be located under the telescope obscuration or because the are optically or electronically dead. Thus, to accurately introduce the aberration on SPHERE using SAXO, it is necessary to modify Eq. (6), where the slopes scorr are computed considering that the 1377 HODM actuators are controlled. To accurately introduce using SAXO, it is indeed necessary to compute the corresponding slopes  that modify only the 999 KL modes controlled by the loop. The available matrices used by SAXO allow us to compute the matrix M that describes the slopes scorr as a set of 999 KL modes mcorr = Mscorr and N its generalized inverse. Thus, NM is the projection that allows computing the slopes
  which are then used to modify Eq. (6):
 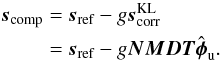 (7)The PCL compensation process on SAXO described above can thus be described as follows. At iteration j, SAXO is closed on a set of reference slopes
  :
:
-
1.
acquisition of the focused
and
diverse
images with IRDIS; -
2.
estimation of the aberration
 upstream of the coronagraph using these images with COFFEE;
 -
3.
computation of the corresponding reference slopes correction:
 ;
;
-
4.
modification of SAXO’s reference slopes whose computation is given by Eq. (7).
 upstream of the coronagraph at the iteration j + 1 of the PCL, computed from COFFEE’s estimated aberration , can be written as
  (8)
(8)
4.2. Contrast optimization on SPHERE
Figure 4 shows the result of the PCL process on SPHERE. The average computation time (Step 2) on a standard PC is Δt = 9.7 min for one iteration, allowing us to compensate for SPHERE quasi-static aberrations. Indeed, the SPHERE quasi-static WFE has been found to increase at a rate of ΔWFE = 0.07 nm rms in H-band per minute (Martinez et al. 2013), which results in an estimation error of Δt × ΔWFE = 0.7 nm rms, which can be neglected.
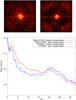 |
Fig. 4 Aberration compensation with COFFEE: PCL on SPHERE (g = 0.5). Top: coronagraphic images recorded from IRDIS before compensation (left) and after 5 PCL iterations (right. log. scale, same dynamic for both images). Bottom: averaged raw contrast profiles computed from the experimental images before (dashed red line) and after (dashed blue line) compensation. For comparison, raw contrast profiles computed from a complete simulation of SAXO before (solid red line) and after compensation (solid blue line) are plotted. |
In the image recorded by IRDIS after five PCL iterations (Fig. 4, top), the aberration compensation has obviously removed speckles in most of the detector plane area controlled by SAXO. The corresponding contrast gain is illustrated by the profiles plotted at the bottom of Fig. 4 (dashed lines). In particular, the contrast is improved by a factor that varies from 1.4 to 4.7 between 2λ/D and 15λ/D. We note that such a gain is superior to the one expected from SPHERE’s baseline (classical phase diversity), which in addition, does not improve the contrast beyond 8λ/D (Sauvage et al. 2012a). The origin of the contrast gain limitation observed here on the IRDIS camera is thoroughly studied in the next section.
Comparing the averaged contrast profiles computed after compensation, one can notice that beyond 18λ/D, the intensity increases on the detector. We have determined and checked by simulations that this behavior is due to the DM’s central actuators, which are not controlled in the same way as the other actuators, since they will be masked by the telescope central obscuration during on-sky observations. However, such an obscuration is not present in the entrance pupil during the calibration phase, hence the energy increase that can be observed in Fig. 4. It is worth mentioning that this increase in high-order speckles does not appear when an obscuration is present in the entrance pupil, as will be the case during scientific observations.
4.3. Compensation process: performance assessment
This section aims at assessing the performance of the PCL process described in Sect. 4.1. This assessment is performed using a simulation that closely mimics the SPHERE instrument. The aberrations φu used to simulate coronagraphic images before compensation are the ones estimated by COFFEE from IRDIS images; besides, we include an inhomogenehous entrance pupil transmission (amplitude aberration), extracted from a entrance pupil plane experimental image recorded from IRDIS. The simulated PCL process closely follows the one used on SPHERE and described in Sect. 4.1:
-
1.
at iteration j, computation of the coronagraphic focused
and
diverse
images using the image formation model described in Eq. (1); -
2.
estimation of the aberrations
upstream of the coronagraph using these images; -
3.
computation of the aberrations upstream of the coronagraph
 at iteration j +
1 using Eq. (8).
at iteration j +
1 using Eq. (8).
, performed with all SAXO’s matrices, allows us to accurately include SPHERE’s AO loop in this PCL simulation. In particular, we take here the presence of the actuators uncontrolled by SAXO into account (such as the dead actuators mentioned in Sect. 4.1), as well as the fact that SAXO controls 999 KL modes instead of the 1377 HODM actuators. As presented in Fig. 4, this results, in turn, in an excellent match between the contrast profiles computed from simulation before and after compensation and the one computed from experimental images recorded from IRDIS.
To evaluate the impact of SAXO’s limitations on the PCL process, we simulated two other scenarii of PCL process with a simplified compensation stage (step 3 of the simulated PCL). First, we considered a compensation process where the aberration upstream of the coronagraph at the iteration j + 1 are computed as 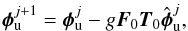 (9)where F0 is the influence matrix that corresponds to a perfect 1377 actuators DM, i.e. a DM where all actuators can be controlled, and T0 its generalized inverse. The compensation described in Eq. (9)can thus be considered as an ideal AO loop that would control the 1377 HODM actuators perfectly, i.e. without any dead actuators or control basis truncation.
Besides, in order to distinguish between the contrast limitation due to dead actuators and the one that comes from the KL modes that are filtered out to improve SAXO’s robustness, a third scenario of PCL was simulated. In this compensation process, where the only limitation lies in dead actuators, the aberration upstream of the coronagraph at the iteration j + 1 are computed as  (10)Here, Fdead denotes the influence matrix of a 1377-actuator DM where the eight influence-function patterns that correspond to SAXO’s dead actuators have been set to 0. Thus, this compensation process allows simulating an AO loop without any control basis truncation, where all actuators but the dead ones are controlled.
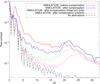 |
Fig. 5 PCL simulation in a SPHERE-like case (g = 0.5): raw contrast profiles computed before (solid red line) and after compensation with a complete simulation of SAXO (CSAXO, solid blue line), without KL modes filtered out (Cdead, dashed green line), and considering an ideal AO loop (i.e., without dead actuators or filtered out modes, CAO, dotted dashed magenta line). For comparison, the contrast profiles computed from a perfect coronagraphic image (no aberrations) is plotted (dotted dashed black line). |
PCLs simulation: Contrast value computed after a compensation performed with a complete simulation of SAXO (CSAXO), with a compensation limited only by dead actuators (Cdead), and with an ideal AO loop (CAO) at different distances from the axis in the coronagraphic images.
In Fig. 5, the comparison of the contrasts obtained with a complete simulation of SAXO CSAXO and the one obtained with an ideal AO loop CAO whose values are given in Table 2 at different positions on the focal plane clearly demonstrates that the main limitation of the PCL process performed on SPHERE lies in SAXO’s control law. Indeed, because of the truncation of its control basis, SAXO cannot compensate for the aberrations that give birth to the remaining speckles. Besides, from the contrast profile computed with an AO loop limited only by SAXO’s dead actuators (Fig. 5), one can see that these dead actuators limit the achievable contrast mainly far from the optical axis (beyond 15λ/D). Such behavior demonstrates that the difference between this contrast profile and the one computed with a complete simulation of SAXO, which is especially important below 15λ/D, originates in the other filtered-out KL modes of the control basis.
Thus, the simulations presented in this section demonstrate that the PCL process used in SPHERE in Sect. 4.2 is limited by SAXO’s control basis truncation. Indeed, dead actuators limit the achievable contrast far from the optical axis (beyond 15λ/D), whereas the others KL modes strongly limit the contrast between 0λ/D and 15λ/D, when filtered out to improve SAXO’s robustness.
Finally, we note that although they cannot be accurately compensated with SAXO, all aberrations upstream of the coronagraph are still accurately estimated by COFFEE. Indeed, one can see that with an ideal AO loop (Eq. (9)), the contrast computed in the focal plane after compensation using COFFEE (Fig. 5) is very close to the one that is computed from a coronagraphic PSF simulated without any phase or amplitude aberration (Fig. 5). This behavior demonstrates the aberration estimation accuracy, which given a perfect compensation stage, would allow one to almost reach the theoretical performance offered by the considered coronagraphic device. These results demonstrate in particular that amplitude aberrations, represented in these simulations by the entrance pupil inhomogeneous transmission, have a very small impact on the achievable contrast in the focal plane, at least in the SPHERE framework. Indeed, the contrast computed with the ALC coronagraph without any aberrations can almost be reached even though amplitude aberrations are neglected.
4.4. Analysis of SPHERE residual aberrations
The aberrations estimated by COFFEE before and after compensation during the PCL process (Sect. 4.2) have now been analyzed. In Fig. 6, which presents both the estimated aberrations and their PSD, the impact of the PCL process performed in Sect. 4.2 can clearly be seen in the estimated aberration map. The aberration level indeed decreases after compensation, which is quantified by the decreasing aberration WFE. Such behavior is confirmed by the PSD (Fig. 6, bottom) of these aberrations: thanks to the PCL, all frequencies controlled by SAXO, from 0 to 20 cycles per pupil (which is SAXO’s cut-off frequency) decrease. Again, such a result demonstrates COFFEE’s usefulness for SPHERE compared to the classical phase diversity, whose own cut-off frequency is eight cycles per pupil.
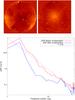 |
Fig. 6 Residual quasi-static aberrations upstream of the coronagraph on SPHERE. Up: aberrations upstream of the coronagraph estimated by COFFEE before (left, WFE = 106 nm rms) and after compensation (right, WFE = 76 nm rms, same dynamic for both images). Bottom: PSD profiles computed for the estimated aberration before (solid red line) and after (solid blue line) compensation. For comparison, a 1 /f2 law is plotted (dashed magenta line). |
In Fig. 6, the PSD of the aberrations estimated before compensation show the same 1 /ν2 behavior as the one found by Dohlen et al. (2011). This result demonstrates that COFFEE can be used as a simple and powerful tool for characterizing SPHERE’s residual aberrations. Indeed, this wavefront sensing method requires only two images to perform the aberration estimation and can be used with the same settings as the ones required by the scientific observation, in particular the coronagraph (which has to be removed for a measurement with a conventional wavefront sensor).
5. Conclusion
In this paper, we have used COFFEE, the coronagraphic phase diversity method, to estimate and compensate for SPHERE’s quasi-static aberrations, leading to a contrast optimization on the IRDIS detector. In Sect. 2, the application of COFFEE to SPHERE was presented and used in Sect. 3 to demonstrate the ability of COFFEE to estimate high-frequency aberrations. We introduced an influence function pattern with SAXO’s HODM and then estimated it with a nanometric precision using COFFEE from coronagraphic images recorded from the IRDIS detector. In Sect. 4, COFFEE was used to compensate for SPHERE’s own quasi-static aberrations. We developed a refined compensation process to modify SAXO’s references slopes using COFFEE’s estimation, which allowed us to optimize the contrast up to a factor 4.7 on the IRDIS detector.
We compared the measured contrast gain with simulations that closely mimic the SPHERE instrument and demonstrated that the compensation was limited by SAXO’s performance. In particular, we have shown that the control basis truncation, performed to take dead actuators and to improve SAXO’s robustness, was responsible for limiting of the achievable contrast. Finally, the residual aberrations estimated by COFFEE were analyzed, demonstrating that this method could also be used as a simple and powerful tool for measuring and characterizing SPHERE’s residual aberrations.
Several perspectives are currently considered to optimize the control of SPHERE’s quasi-static aberrations. First, the compensation stage used in the PCL process should be improved to allow an even greater contrast gain. Two solutions are currently considered. The first one consists in a modified control loop that would use a control matrix where less KL modes would be filtered out. Such a control matrix, which would be used only for the system calibration (and not during the scientific observation) would allow one to compensate for the aberrations that corresponds to the KL modes that were filtered out in this paper, leading to an improved contrast gain. Still, such a compensation would be limited by dead actuators, which limits the achievable contrast expecially far from the optical axis, as demonstrated in this paper. Improved performance can be achieved by using dark hole methods, such as the one proposed by Paul et al. (2013a), which consists in minimizing the energy in a selected area on the detector. Notably, it should be possible to perform this minimization over the 999 KL modes controlled by SAXO, which would lead to a far better contrast on the detector than the one achievable using conventional phase conjugation. Further perspectives include deriving the regularization metrics from the analysis of the intensity distribution in the coronagraphic image. Besides, to optimize the dark hole–based compensation, we are currently working on an extension of COFFEE able to estimate amplitude aberrations. Preliminary simulations suggest that in order to estimate the amplitude aberration along with phase aberrations, COFFEE will require a third coronagraphic image, created by introducing another diversity phase φdiv2 upstream of the coronagraph.
Acknowledgments
The authors would like to thank the Région Provence-Alpes-Côte d’Azur for partial financial support of B. Paul’s scholarship. This work was partly funded by the European Commission under FP7 Grant Agreement No. 312430 Optical Infrared Coordination Network for Astronomy, and by the Office National d’Études et de Recherches Aérospatiales (ONERA) in the framework of the NAIADE Research Project. SPHERE is an instrument designed and built by a consortium consisting of IPAG, MPIA, LAM, LESIA, Laboratoire Fizeau, INAF, Observatoire de Geneve, ETH, NOVA, ONERA and ASTRON in collaboration with ESO.
References
- Baudoz, P., Boccaletti, A., Baudrand, J., & Rouan, D. 2006, in Proc. IAU Colloq., 200, 553 [Google Scholar]
- Beuzit, J.-L., Feldt, M., Dohlen, K., et al. 2007, in Proc. Conf. In the Spirit of Bernard Lyot: The Direct Detection of Planets and Circumstellar Disks in the 21st Century, ed. P. Kalas, University of California, Berkeley, CA, USA [Google Scholar]
- Dohlen, K., Wildi, F., Beuzit, J., et al. 2011, in Adaptive Optics for Extremely Large Telescopes (AO4ELT) [Google Scholar]
- Give’on, A., Belikov, R., Shaklan, S., & Kasdin, J. 2007, Opt. Express, 15, 12338 [CrossRef] [Google Scholar]
- Hugot, E., Ferrari, M., El Hadi, K., et al. 2012, A&A, 538, A139 [NASA ADS] [CrossRef] [EDP Sciences] [Google Scholar]
- Kalas, P., Graham, J. R., Chiang, E., et al. 2008, Science, 332, 1345 [NASA ADS] [CrossRef] [Google Scholar]
- Lagrange, A.-M., Gratadour, D., Chauvin, G., et al. 2009, A&A, 493, L21 [NASA ADS] [CrossRef] [EDP Sciences] [Google Scholar]
- Macintosh, B. A., Graham, J. R., Palmer, D. W., et al. 2008, in Adaptive Optics Systems, Proc. Soc. Photo-Opt. Instrum. Eng., 7015 [Google Scholar]
- Marois, C., Macintosh, B., Barman, T., et al. 2008, Science, 322, 1348 [NASA ADS] [CrossRef] [PubMed] [Google Scholar]
- Martinez, P., Kasper, M., Costille, A., et al. 2013, A&A, 554, A41 [NASA ADS] [CrossRef] [EDP Sciences] [Google Scholar]
- Mugnier, L. M., Blanc, A., & Idier, J. 2006, in Advances in Imaging and Electron Physics (Elsevier) ed. P. Hawkes, 141, 1 [Google Scholar]
- Paul, B., Mugnier, L. M., Sauvage, J.-F., Dohlen, K., & Ferrari, M. 2013a, Opt. Express, 21, 31751 [NASA ADS] [CrossRef] [Google Scholar]
- Paul, B., Sauvage, J.-F., & Mugnier, L. M. 2013b, A&A, 552, A48 [NASA ADS] [CrossRef] [EDP Sciences] [Google Scholar]
- Petit, C., Conan, J.-M., Fusco, T., et al. 2008, in Adaptive Optics Systems, eds. N. Hubin, C. E. Max, & P. L. Wizinowich, Proc. Soc. Photo-Opt. Instrum. Eng., 7015 [Google Scholar]
- Sauvage, J.-F., Fusco, T., Petit, C., et al. 2012a, in Adaptive Optics Systems III, Proc. Soc. Photo-Opt. Instrum. Eng., 8447 [Google Scholar]
- Sauvage, J.-F., Mugnier, L. M., Paul, B., & Villecroze, R. 2012b, Opt. Lett., 37, 4808 [NASA ADS] [CrossRef] [Google Scholar]
All Tables
PCLs simulation: Contrast value computed after a compensation performed with a complete simulation of SAXO (CSAXO), with a compensation limited only by dead actuators (Cdead), and with an ideal AO loop (CAO) at different distances from the axis in the coronagraphic images.
All Figures
|
Fig. 1 Schematic representation of SPHERE. To apply COFFEE on this instrument, coronagraphic images were recorded from the IRDIS detector. |
| In the text | |
|
Fig. 2 Experimental images of SPHERE’s entrance pupil apodizer (left) and of the Lyot Stop pupil transmission (right). |
| In the text | |
|
Fig. 3 High-order aberration (poke) estimation on SPHERE with COFFEE. Top: introduced poke (left, ϵ = 144 nm PV) and COFFEE-estimated poke (right, ϵest = 147 nm PV). Bottom: experimental image recorded from IRDIS (left) and image computed using the reconstructed aberration (right) (log. scale, same range for both images). |
| In the text | |
|
Fig. 4 Aberration compensation with COFFEE: PCL on SPHERE (g = 0.5). Top: coronagraphic images recorded from IRDIS before compensation (left) and after 5 PCL iterations (right. log. scale, same dynamic for both images). Bottom: averaged raw contrast profiles computed from the experimental images before (dashed red line) and after (dashed blue line) compensation. For comparison, raw contrast profiles computed from a complete simulation of SAXO before (solid red line) and after compensation (solid blue line) are plotted. |
| In the text | |
|
Fig. 5 PCL simulation in a SPHERE-like case (g = 0.5): raw contrast profiles computed before (solid red line) and after compensation with a complete simulation of SAXO (CSAXO, solid blue line), without KL modes filtered out (Cdead, dashed green line), and considering an ideal AO loop (i.e., without dead actuators or filtered out modes, CAO, dotted dashed magenta line). For comparison, the contrast profiles computed from a perfect coronagraphic image (no aberrations) is plotted (dotted dashed black line). |
| In the text | |
|
Fig. 6 Residual quasi-static aberrations upstream of the coronagraph on SPHERE. Up: aberrations upstream of the coronagraph estimated by COFFEE before (left, WFE = 106 nm rms) and after compensation (right, WFE = 76 nm rms, same dynamic for both images). Bottom: PSD profiles computed for the estimated aberration before (solid red line) and after (solid blue line) compensation. For comparison, a 1 /f2 law is plotted (dashed magenta line). |
| In the text | |
Current usage metrics show cumulative count of Article Views (full-text article views including HTML views, PDF and ePub downloads, according to the available data) and Abstracts Views on Vision4Press platform.
Data correspond to usage on the plateform after 2015. The current usage metrics is available 48-96 hours after online publication and is updated daily on week days.
Initial download of the metrics may take a while.