Fig. 5
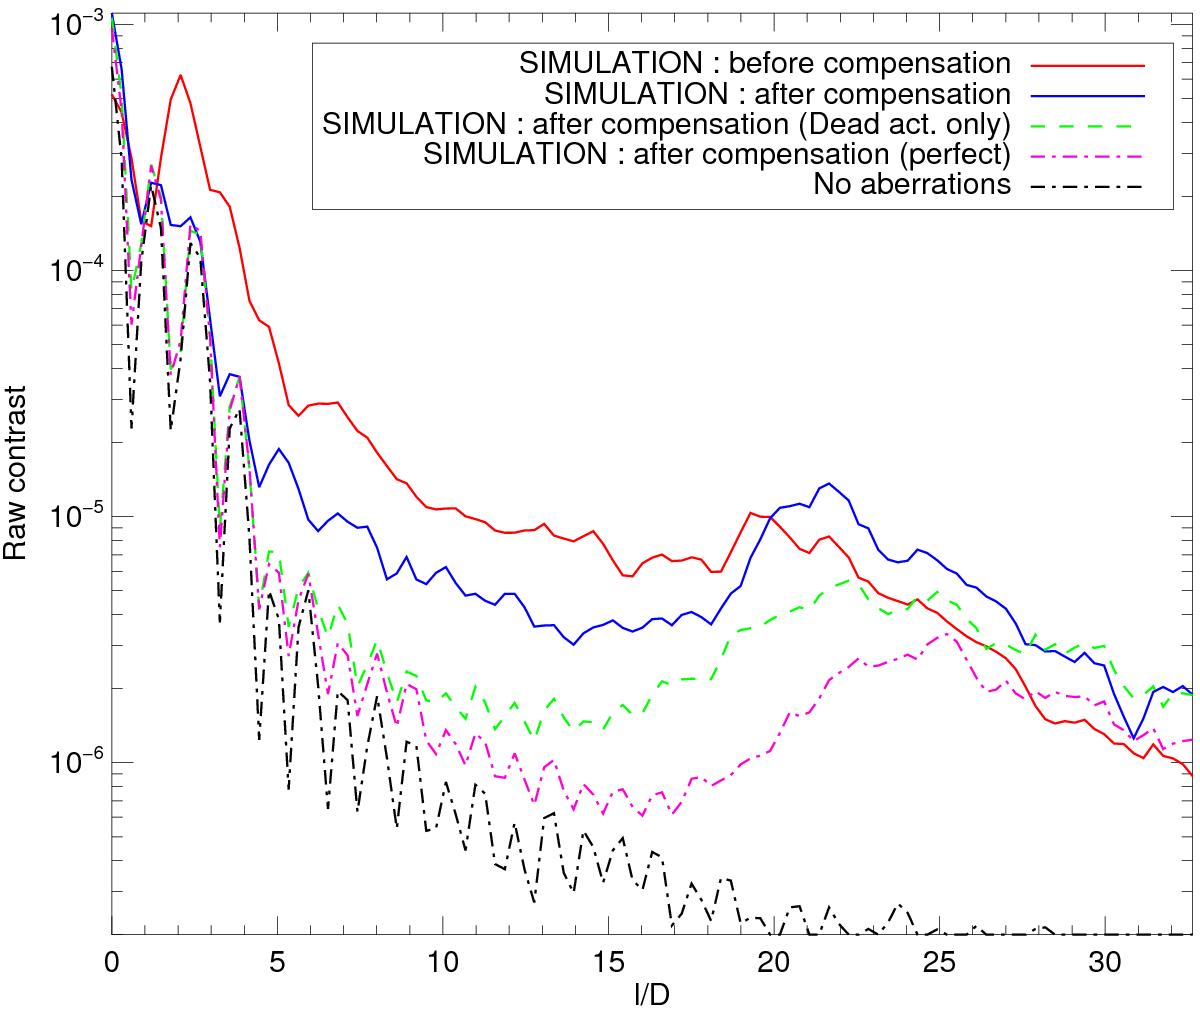
PCL simulation in a SPHERE-like case (g = 0.5): raw contrast profiles computed before (solid red line) and after compensation with a complete simulation of SAXO (CSAXO, solid blue line), without KL modes filtered out (Cdead, dashed green line), and considering an ideal AO loop (i.e., without dead actuators or filtered out modes, CAO, dotted dashed magenta line). For comparison, the contrast profiles computed from a perfect coronagraphic image (no aberrations) is plotted (dotted dashed black line).
Current usage metrics show cumulative count of Article Views (full-text article views including HTML views, PDF and ePub downloads, according to the available data) and Abstracts Views on Vision4Press platform.
Data correspond to usage on the plateform after 2015. The current usage metrics is available 48-96 hours after online publication and is updated daily on week days.
Initial download of the metrics may take a while.