Fig. 3
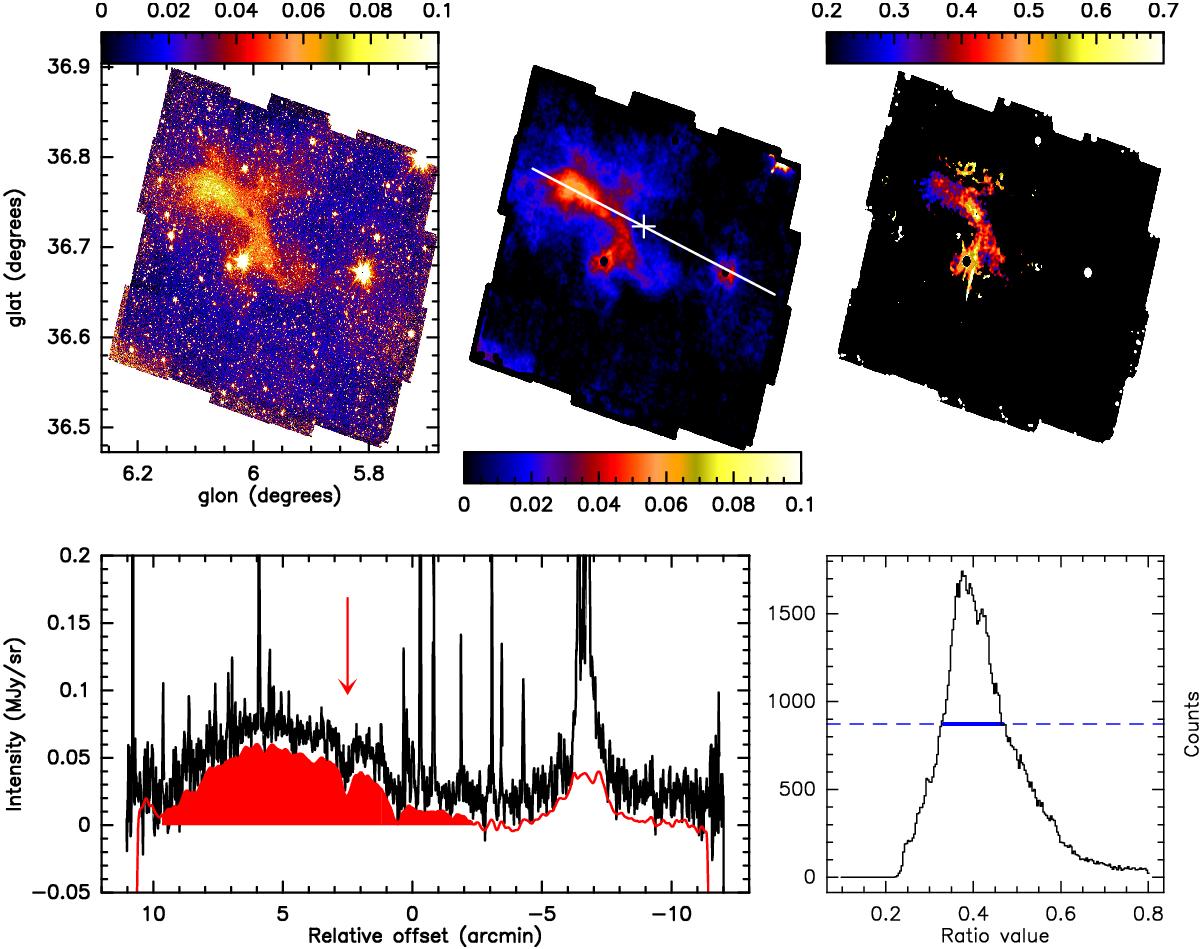
Top: from left to right, L183 original image in galactic coordinates from the HCS survey (IRAC 1, 3.6 μm), point sources and background-subtracted image showing the 3.6 μm coreshine intensity (with a Gaussian smoothing), and coreshine ratio (4.5/3.6) image. The white line shows the position of the cut presented below, the white cross indicates the zero-position reference. Bottom left: the profile through the cut for the source data (black) and through the cleaned and smoothed image (red); the 3.6 μm coreshine zone is highlighted by the red shading. The intensities are given in MJy sr-1. The cut has been chosen to fit both a region with strong coreshine intensity (~50 kJy sr-1 here) and to show the internal depression, which traces self-absorption, ~2.5 arcmin from the zero reference, marked by the red arrow on the profile. Bottom right: the coreshine ratio histogram. The blue line displays the FWHM of the histogram.
Current usage metrics show cumulative count of Article Views (full-text article views including HTML views, PDF and ePub downloads, according to the available data) and Abstracts Views on Vision4Press platform.
Data correspond to usage on the plateform after 2015. The current usage metrics is available 48-96 hours after online publication and is updated daily on week days.
Initial download of the metrics may take a while.