Fig. 12
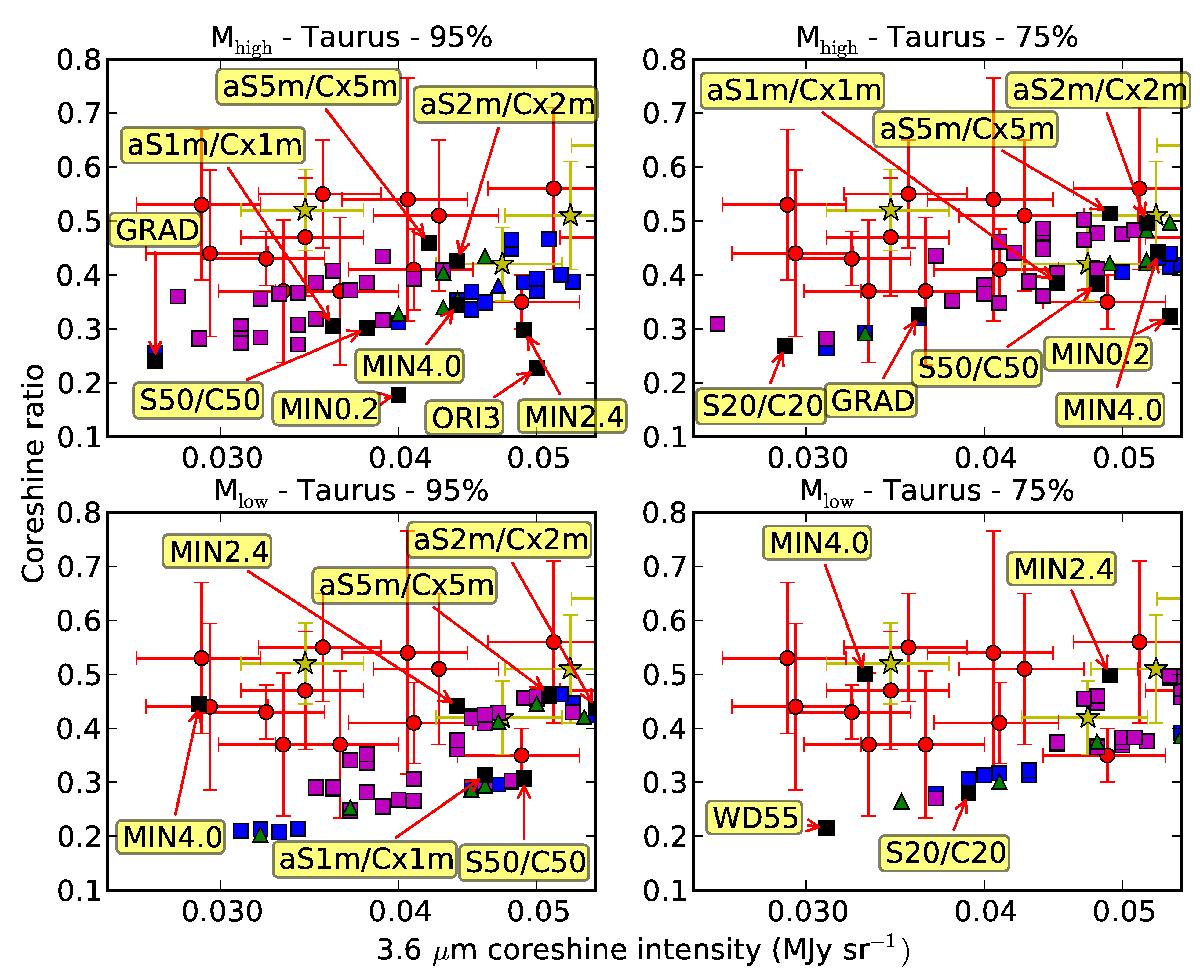
Coreshine ratio versus 3.6 μm intensity in the Taurus-Perseus direction. Zoom on the starless core cases, full range is displayed in Fig. 14 – Difference between Mhigh (upper row) and Mlow (lower row) modeling without internal source for the two background fractions (95%, bg1, left, 75%, bg2, right). Observations – red circles: starless cores; yellow stars: cores with YSOs. Models – black squares: single grain population; blue squares: carbonates bigger than silicates in at least one of the two layers; purple squares: silicates bigger than carbonates in at least one of the two layers; green triangles: everything else. Grain model names refer to Table 3 for spatially constant grain size distribution.
Current usage metrics show cumulative count of Article Views (full-text article views including HTML views, PDF and ePub downloads, according to the available data) and Abstracts Views on Vision4Press platform.
Data correspond to usage on the plateform after 2015. The current usage metrics is available 48-96 hours after online publication and is updated daily on week days.
Initial download of the metrics may take a while.