Fig. 6
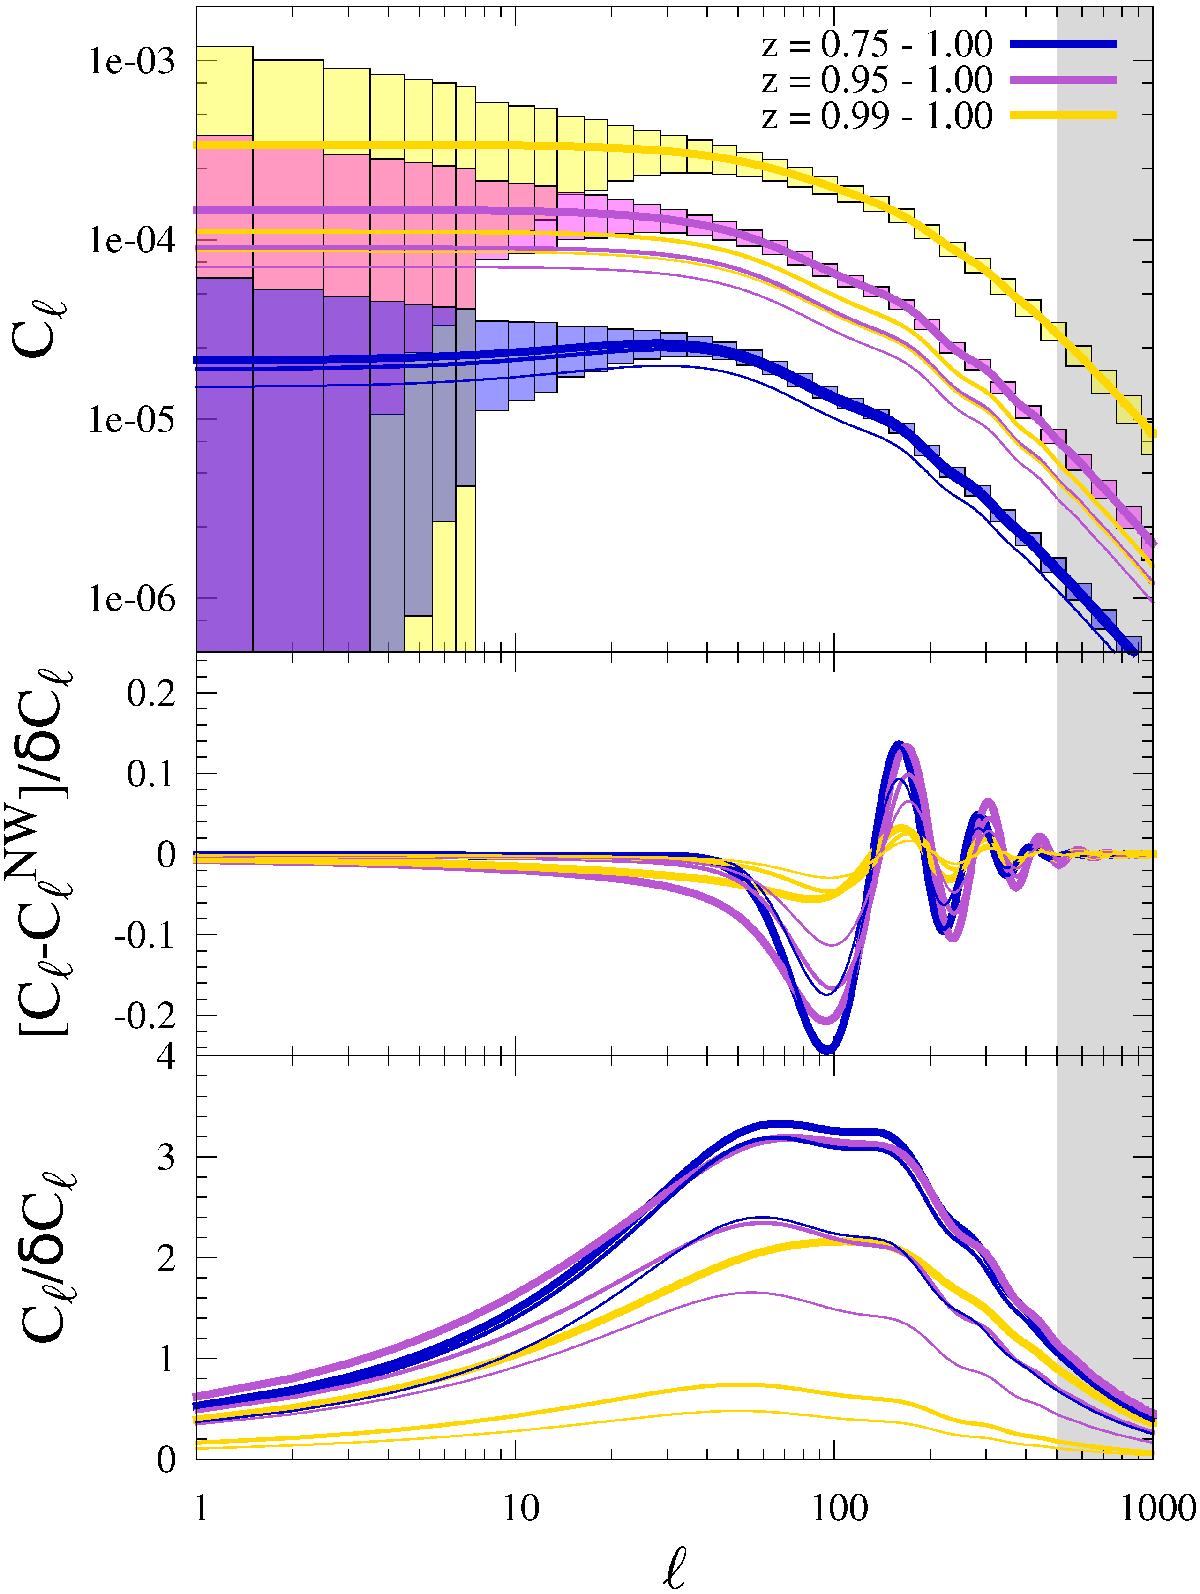
Example angular auto-spectra (upper panel) and unbinned signal-to-noise ratios for the BAO (middle panel) and for the whole spectra (lower panel). Three different choices for the size of the photo-z bin are shown. The lines with three different thickness levels, starting from the thickest, assume the optical follow-up parameters (i) σ0 = 10-3, ffail = 0.0; (ii) σ0 = 10-2, ffail = 0.0; and (iii) σ0 = 10-2, ffail = 0.3, respectively. In the upper panel for the first of the above three cases binned 1σ error boxes are also shown. The light gray vertical stripe marks the small-scale modes excluded from our analysis.
Current usage metrics show cumulative count of Article Views (full-text article views including HTML views, PDF and ePub downloads, according to the available data) and Abstracts Views on Vision4Press platform.
Data correspond to usage on the plateform after 2015. The current usage metrics is available 48-96 hours after online publication and is updated daily on week days.
Initial download of the metrics may take a while.