Free Access
Fig. 9
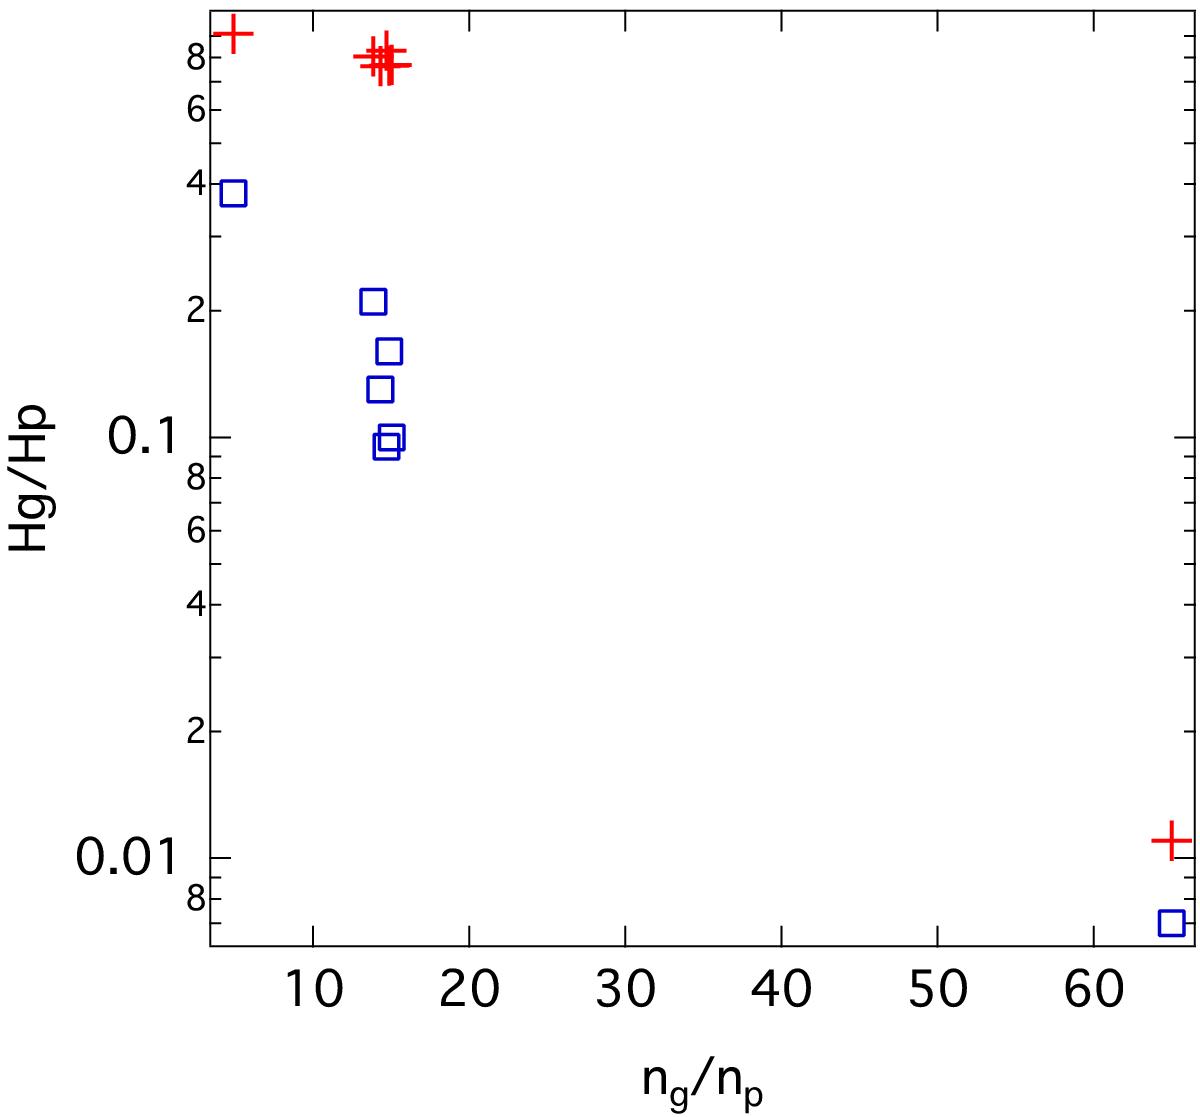
Height ratio between a g-type (the ℓ = 1 with the highest inertia close to νmax) mode and a p-type mode around νmax as a function of ng/np for all our models. Red crosses represent the ideal case where all the modes are resolved. Blue squares are for observation durations of one year.
Current usage metrics show cumulative count of Article Views (full-text article views including HTML views, PDF and ePub downloads, according to the available data) and Abstracts Views on Vision4Press platform.
Data correspond to usage on the plateform after 2015. The current usage metrics is available 48-96 hours after online publication and is updated daily on week days.
Initial download of the metrics may take a while.