Fig. 7
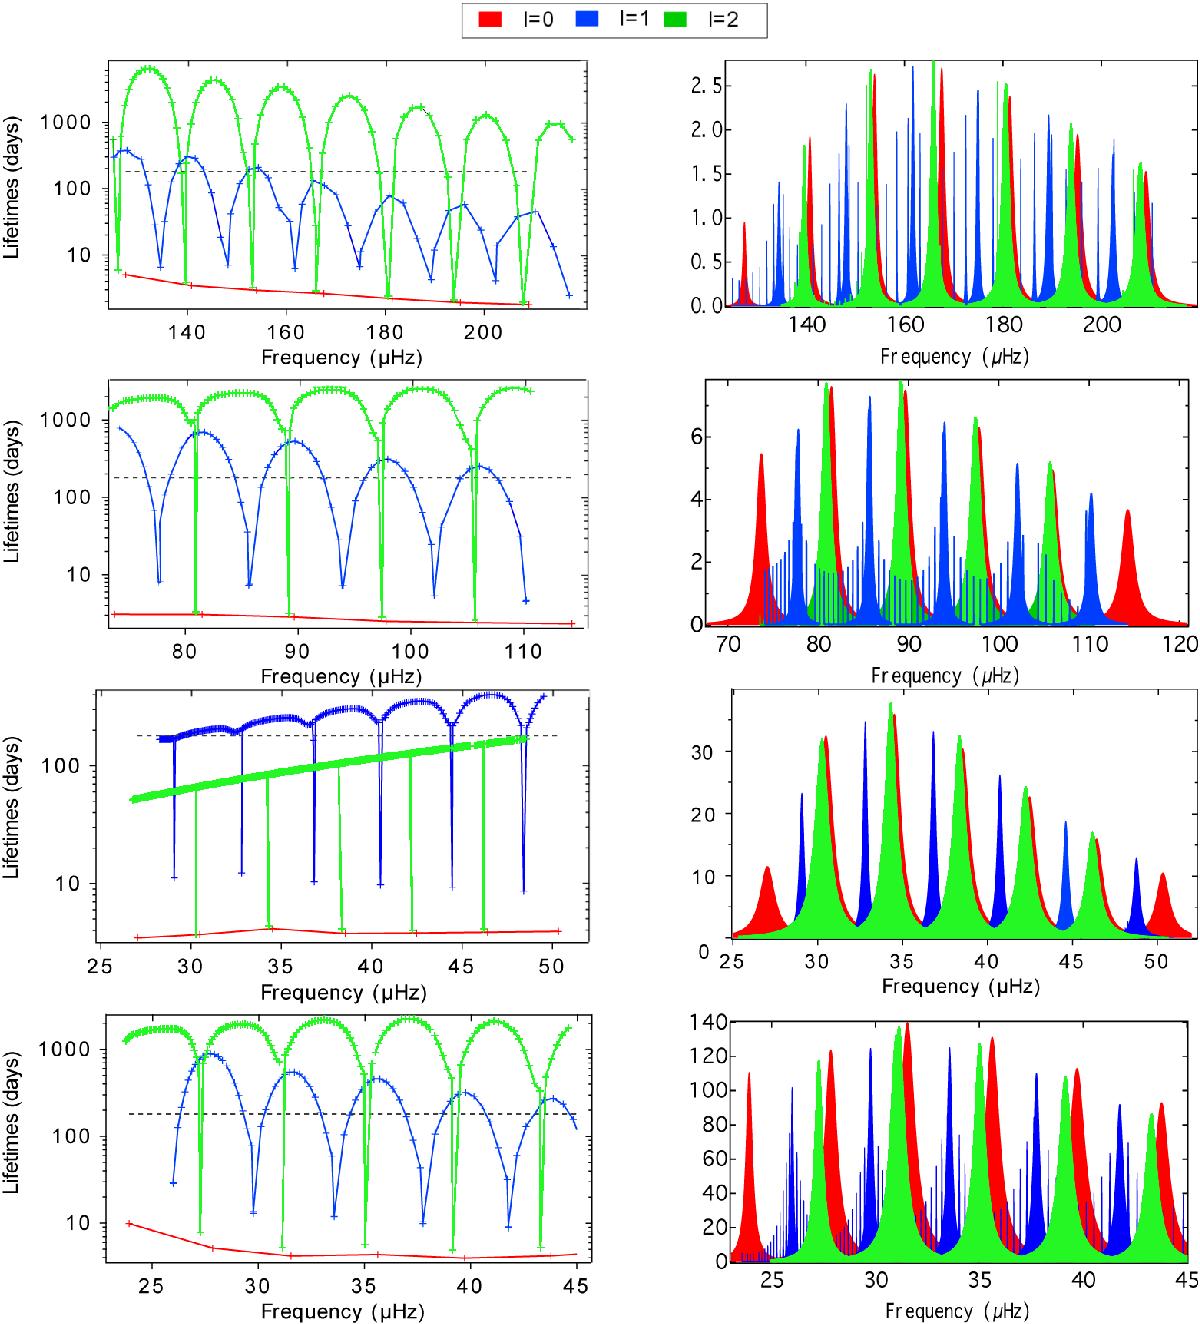
Left: lifetimes of ℓ = 0 (red), ℓ = 1 (blue), and ℓ = 2 (green) modes in Models A, B, C, and D (from top panel to bottom). The dashed line represents Tobs/ 2. Right: corresponding power spectra. The heights in power spectra are given in (m/s)2/μHz. For the sake of simplicity, all peaks are modelled by a Lorentzian, and we did not account for the different mode visibilities that depend on the angular degree. The resolution criteria (and so the time of observation) is taken into account for the height of the modes.
Current usage metrics show cumulative count of Article Views (full-text article views including HTML views, PDF and ePub downloads, according to the available data) and Abstracts Views on Vision4Press platform.
Data correspond to usage on the plateform after 2015. The current usage metrics is available 48-96 hours after online publication and is updated daily on week days.
Initial download of the metrics may take a while.