Free Access
Fig. B.1
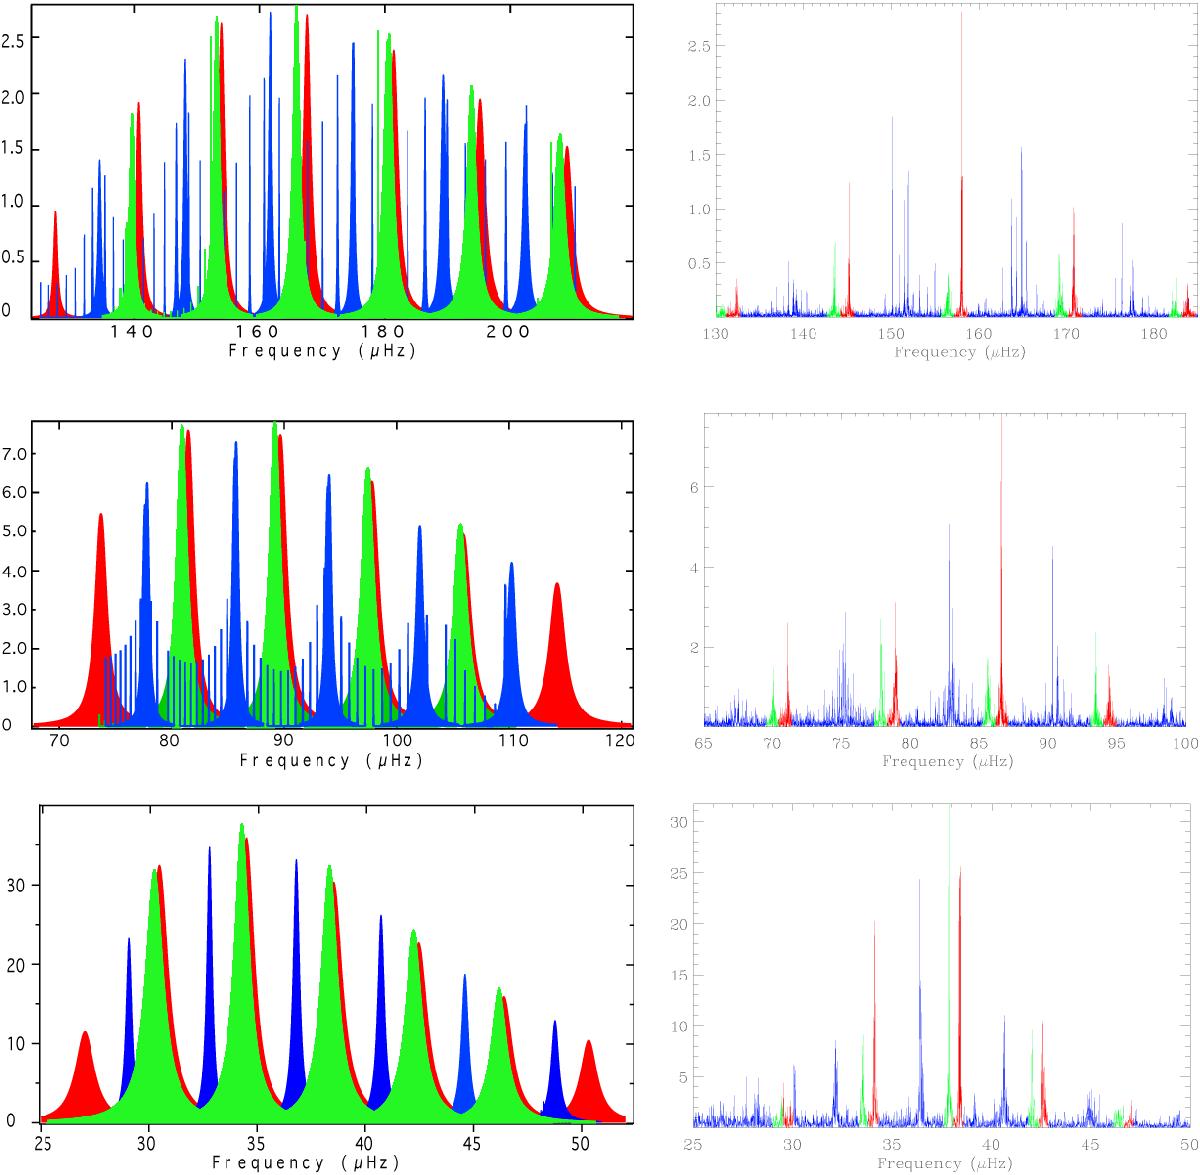
Theoretical and observed power spectra of Kepler stars with similar masses (from top to bottom: 1.44, 1.48, 1.47 M⊙), Δν, and νmax. The heights in theoretical power spectra are in (m/s)2/μHz. The heights for observed spectra are given in ppm2/μHz divided by a factor 6000 to have scales similar to the theoretical spectra.
Current usage metrics show cumulative count of Article Views (full-text article views including HTML views, PDF and ePub downloads, according to the available data) and Abstracts Views on Vision4Press platform.
Data correspond to usage on the plateform after 2015. The current usage metrics is available 48-96 hours after online publication and is updated daily on week days.
Initial download of the metrics may take a while.