Fig. 11
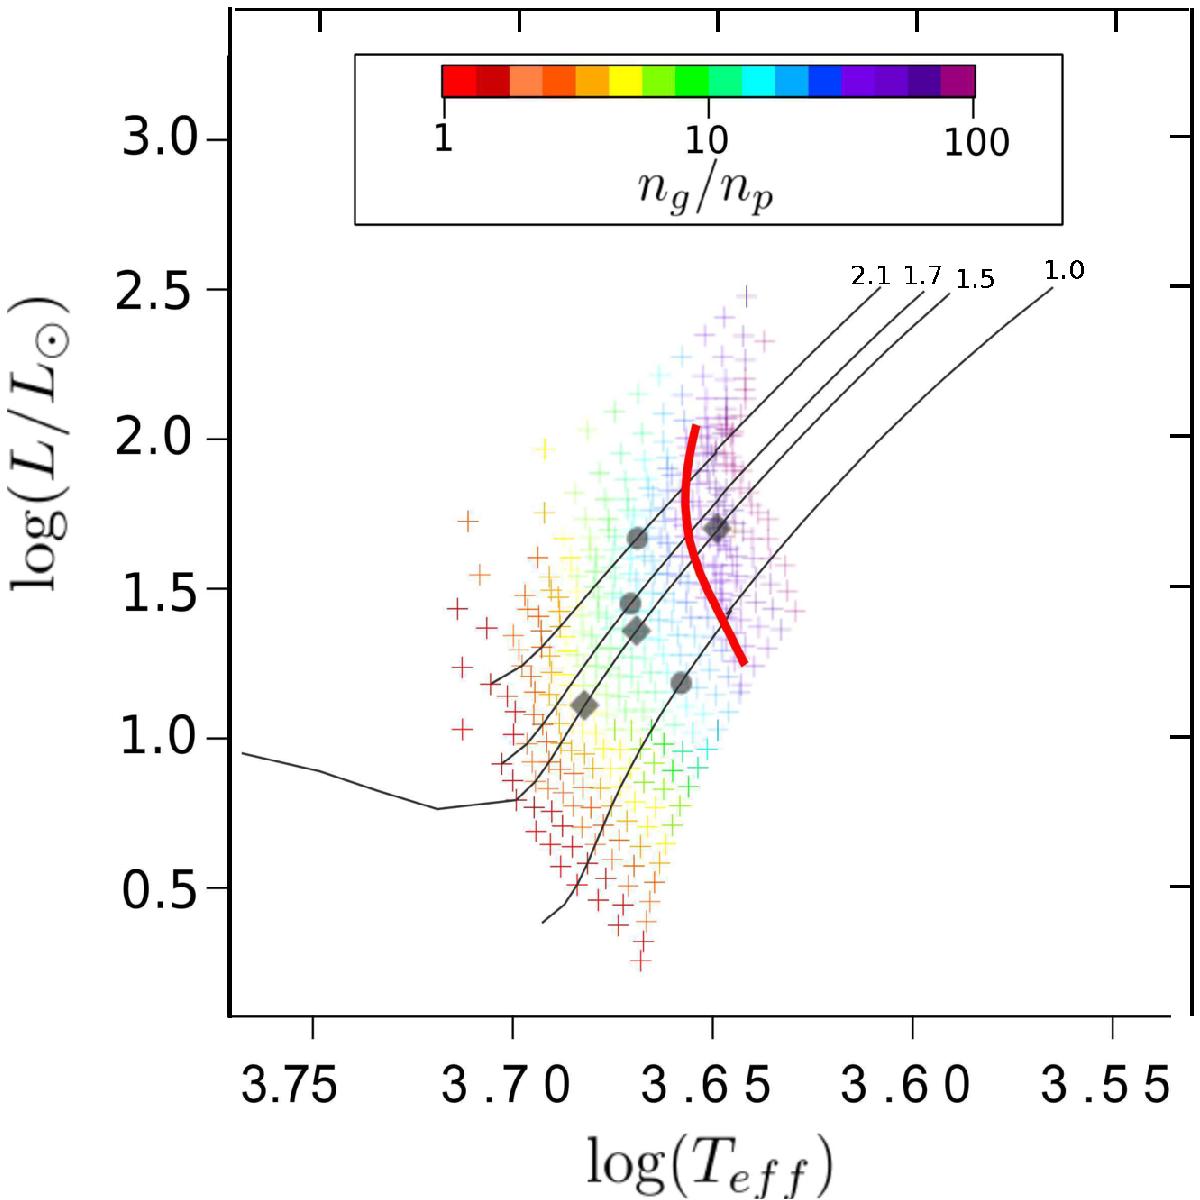
Evolutionary tracks in the HR diagram of all our red-giant branch models. Numbers on the top of the tracks indicate the mass of the star (in M⊙). The color scale indicates models with the same number of mixed modes by large separation. The red line represents the detectability limit we have found for the dipole modes (assuming that all modes are fully resolved).
Current usage metrics show cumulative count of Article Views (full-text article views including HTML views, PDF and ePub downloads, according to the available data) and Abstracts Views on Vision4Press platform.
Data correspond to usage on the plateform after 2015. The current usage metrics is available 48-96 hours after online publication and is updated daily on week days.
Initial download of the metrics may take a while.