Free Access
Fig. 1
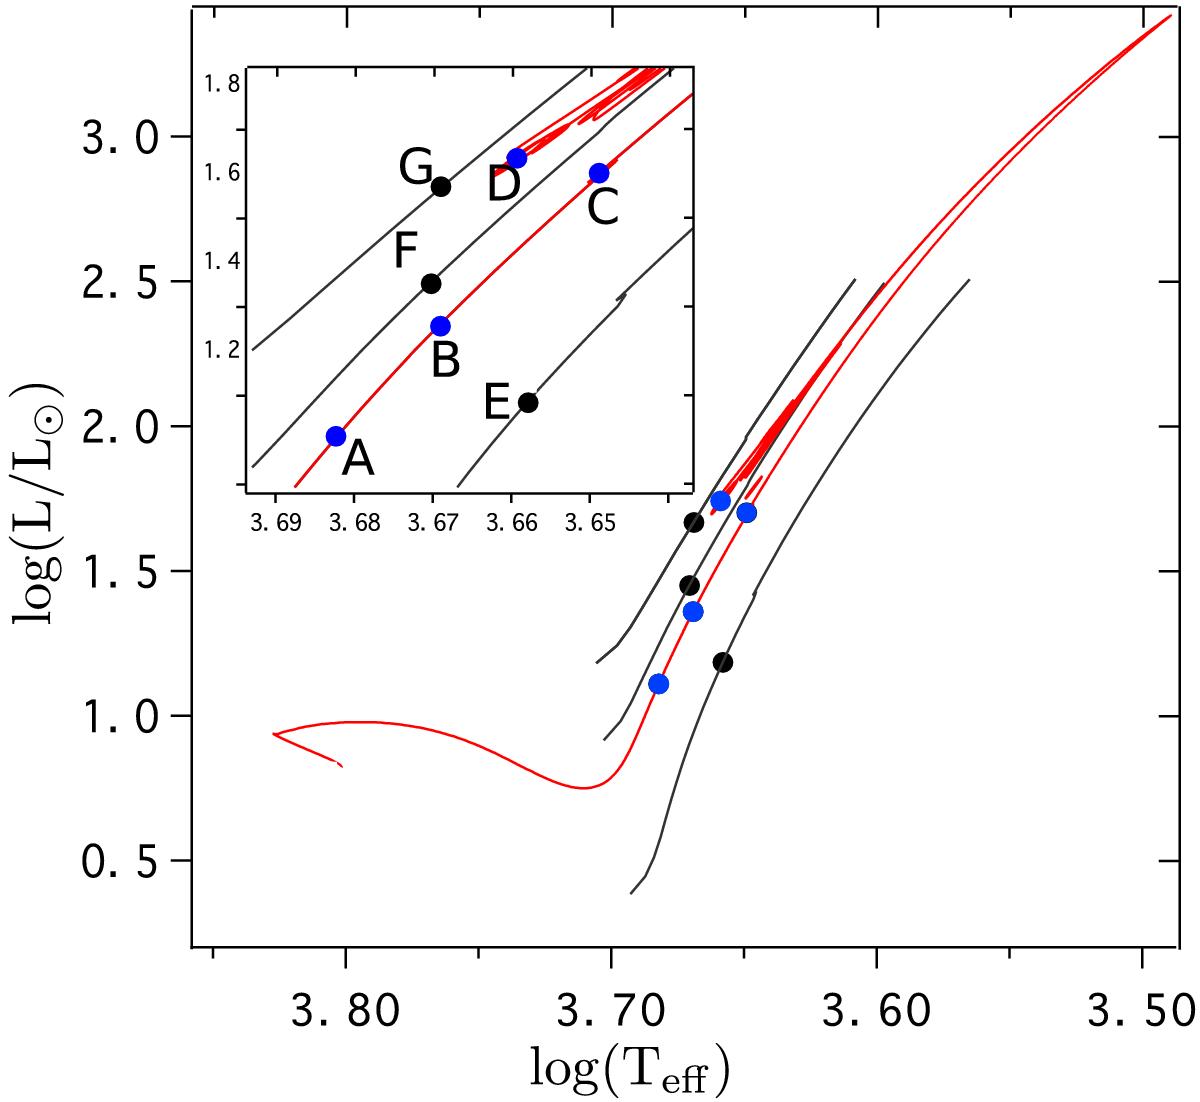
Evolutionary tracks in the Hertzprung-Russel diagram of our models. Selected models are represented by dots. Blue dots correspond to models of a 1.5 M⊙ star at different ages (on the red-giant branch and in the clump). Black dots corresponds to models with the same number of mixed modes over a large separation.
Current usage metrics show cumulative count of Article Views (full-text article views including HTML views, PDF and ePub downloads, according to the available data) and Abstracts Views on Vision4Press platform.
Data correspond to usage on the plateform after 2015. The current usage metrics is available 48-96 hours after online publication and is updated daily on week days.
Initial download of the metrics may take a while.