Fig. B.1
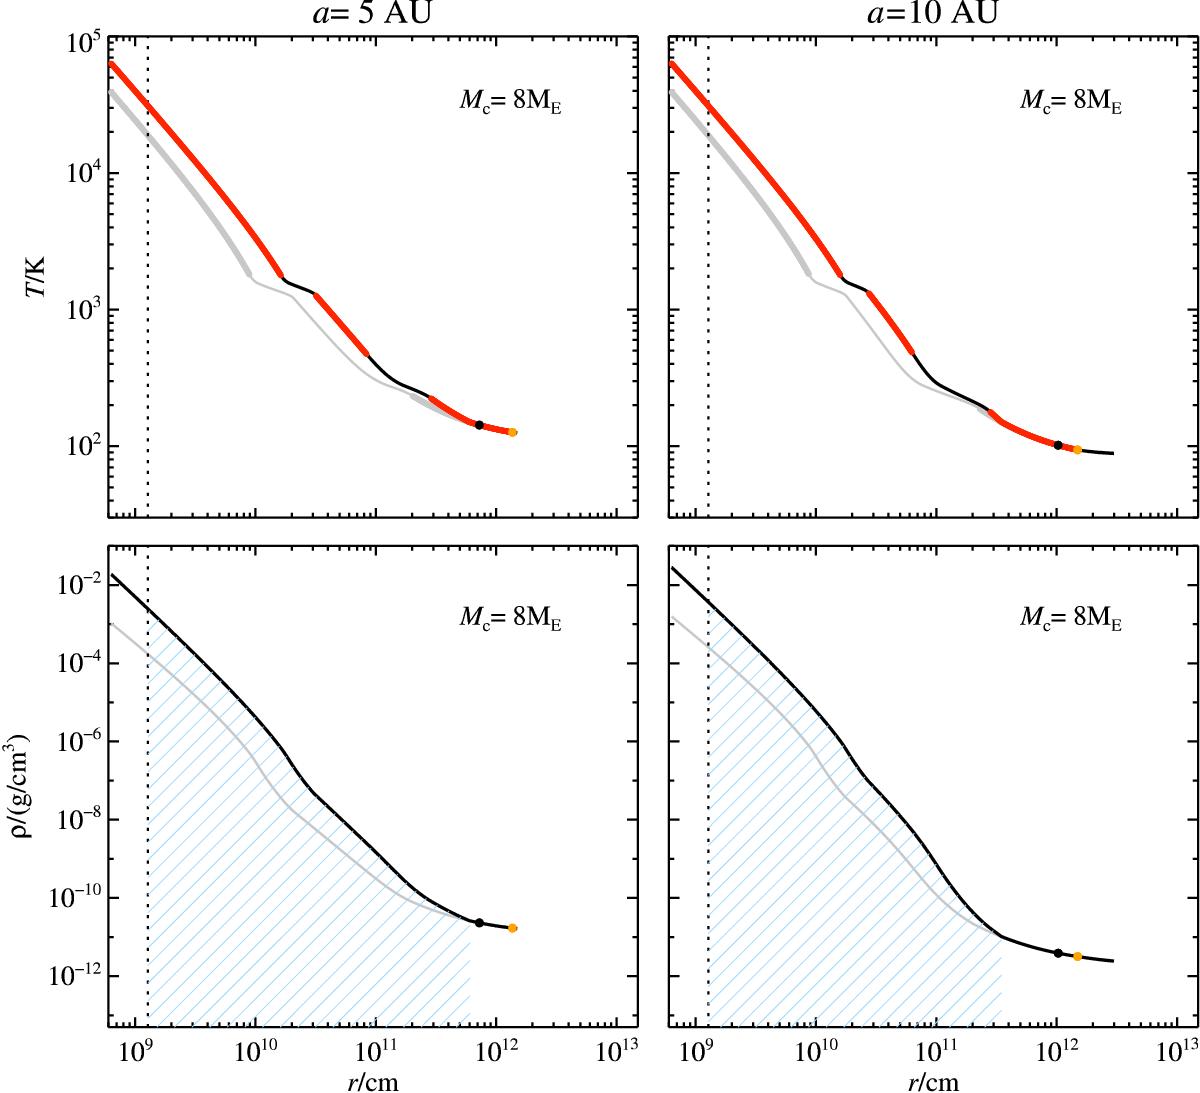
Dependence of the hydrostatic envelope on orbital radius and envelope pollution. The left panels give the temperature (top) and density profile (bottom), for both a 50% polluted and unpolluted atmosphere (grey curve) of an 8 ME core accreting pebbles at 5 AU. Thick lines represent the regions where heat transport by convection dominates. The profile is given starting from the connection point to the Hill sphere. The yellow circle gives the photosphere of the envelope, while the black circle indicates the Bondi radius (the distance where the escape speed equals the local sound speed). The depth at which the envelope density is enhanced by water vapour is marked by the dashed blue lines in the lower panels. The dotted line represents the core radius (assuming ρc = 5.5 g/cm3). The right column is similar, but for a planet orbiting at 10 AU.
Current usage metrics show cumulative count of Article Views (full-text article views including HTML views, PDF and ePub downloads, according to the available data) and Abstracts Views on Vision4Press platform.
Data correspond to usage on the plateform after 2015. The current usage metrics is available 48-96 hours after online publication and is updated daily on week days.
Initial download of the metrics may take a while.