Fig. 5
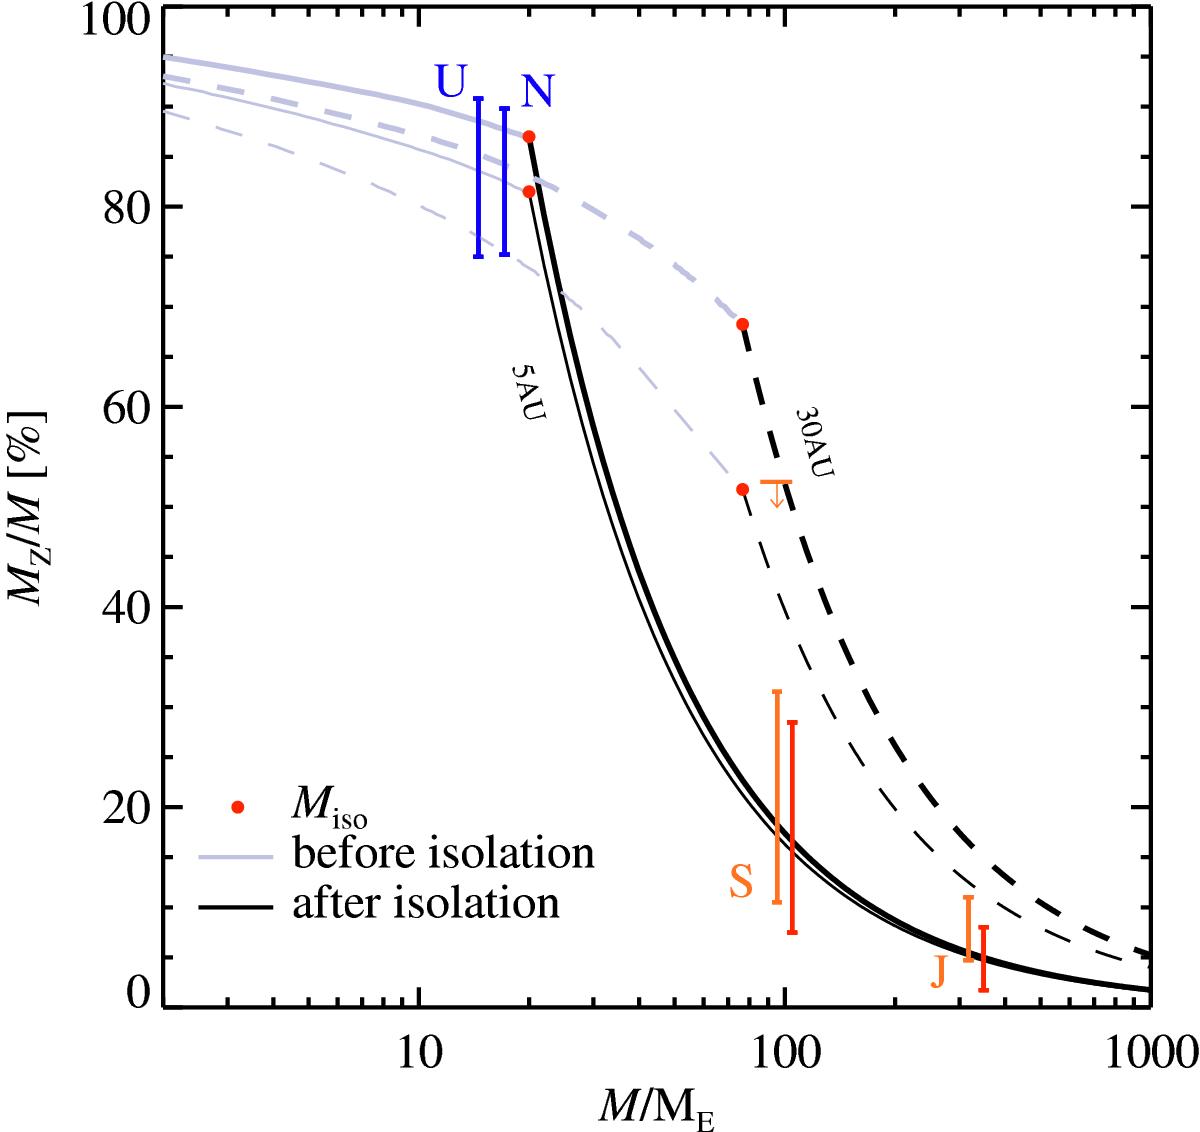
Similar to Fig. 4, but representing planetary compositions of planets located at 5 and 30 AU (full and dashed lines respectively) for different values of the accretion rate efficiency ϵ. The thick solid lines correspond to the case where the full pebble accretion luminosity is released (ϵ = 1) and the lower thin lines of the same colour to a 10 times smaller luminosity (ϵ = 0.1). The red error bars, slightly displaced to the left for readability, give the heavy element mass, without the contribution of heavy elements added by late time gas accretion in a disc with increased dust-to-gas ratio (Guillot & Hueso 2006), as suggested to explain the noble gas abundances in Jupiter. The orange downwards arrow is an upper limit on the heavy element content of Saturn if layered convection occurs in the envelope (Leconte & Chabrier 2013).
Current usage metrics show cumulative count of Article Views (full-text article views including HTML views, PDF and ePub downloads, according to the available data) and Abstracts Views on Vision4Press platform.
Data correspond to usage on the plateform after 2015. The current usage metrics is available 48-96 hours after online publication and is updated daily on week days.
Initial download of the metrics may take a while.