Fig. 1
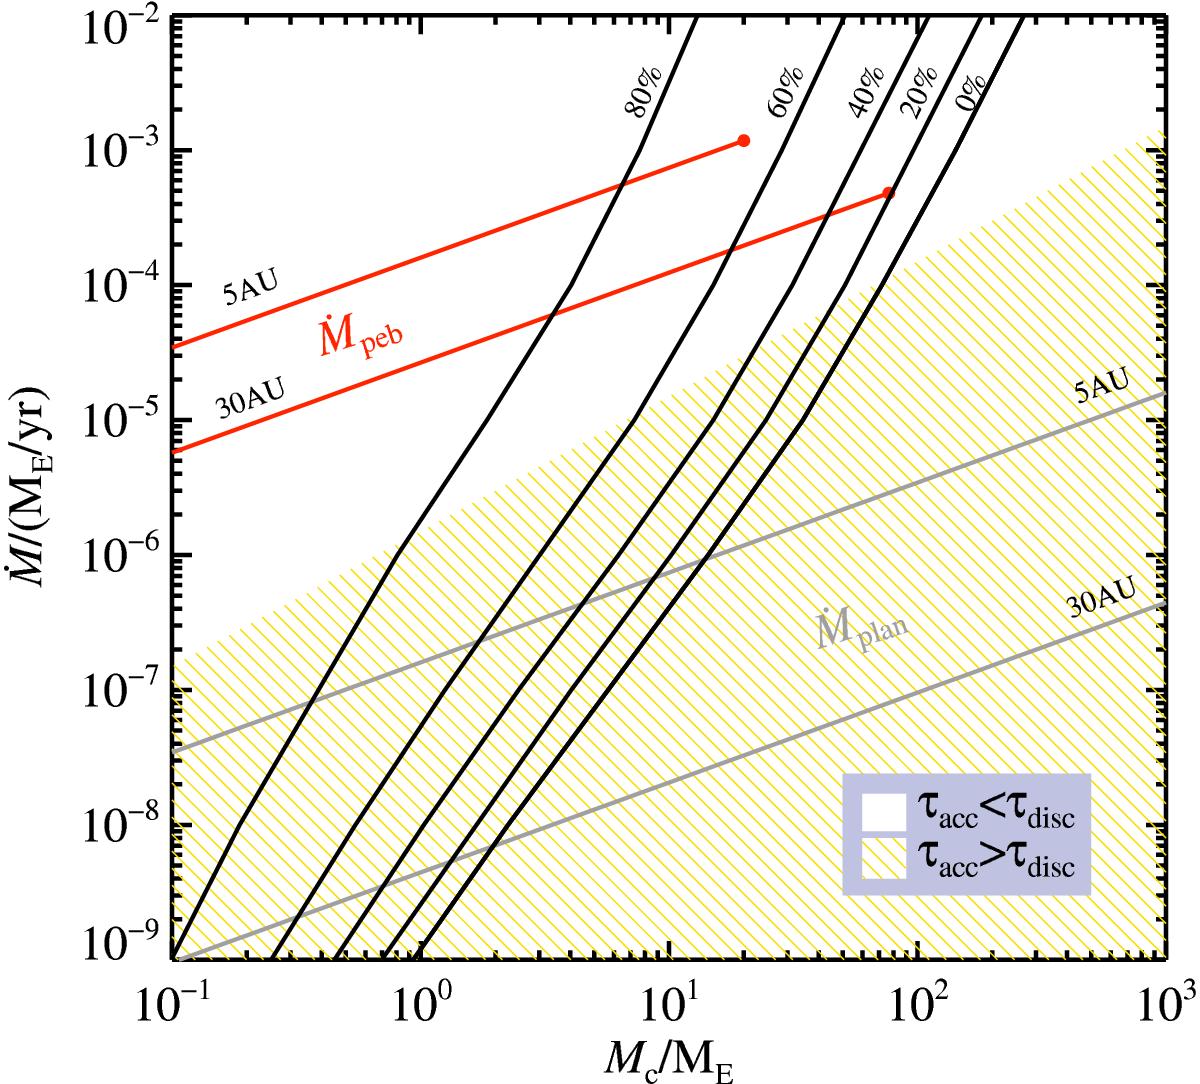
Pebble accretion rates (red), planetesimal accretion rates (grey), and minimal accretion rates required to sustain a stable gas envelope (black), as a function of the core mass. The curves for the minimal accretion rates are nearly independent of orbital radius between 5−30 AU, but depend strongly on the opacity (Appendix B.3) and on the level of envelope pollution by sublimation of icy pebbles. Labels at the top of the figure indicate H2O pollution of the atmosphere as a percentage with respect to pure H/He nebular gas, corresponding to the fraction 1 − β from Eq. (11). The critical core mass to collapse the gas envelope can be found at the intersection of an accretion curve with a critical curve. Accretion rate curves that fall in the yellow dashed region are too slow to form the cores of the giant planets before the dissipation of the gas disc (τacc = Mc/Ṁc>τdisc = 2 Myr). Red circles mark the mass above which pebble accretion is halted (Eq. (12)) and the gravitational collapse of the gas envelope is triggered.
Current usage metrics show cumulative count of Article Views (full-text article views including HTML views, PDF and ePub downloads, according to the available data) and Abstracts Views on Vision4Press platform.
Data correspond to usage on the plateform after 2015. The current usage metrics is available 48-96 hours after online publication and is updated daily on week days.
Initial download of the metrics may take a while.