Fig. A.1
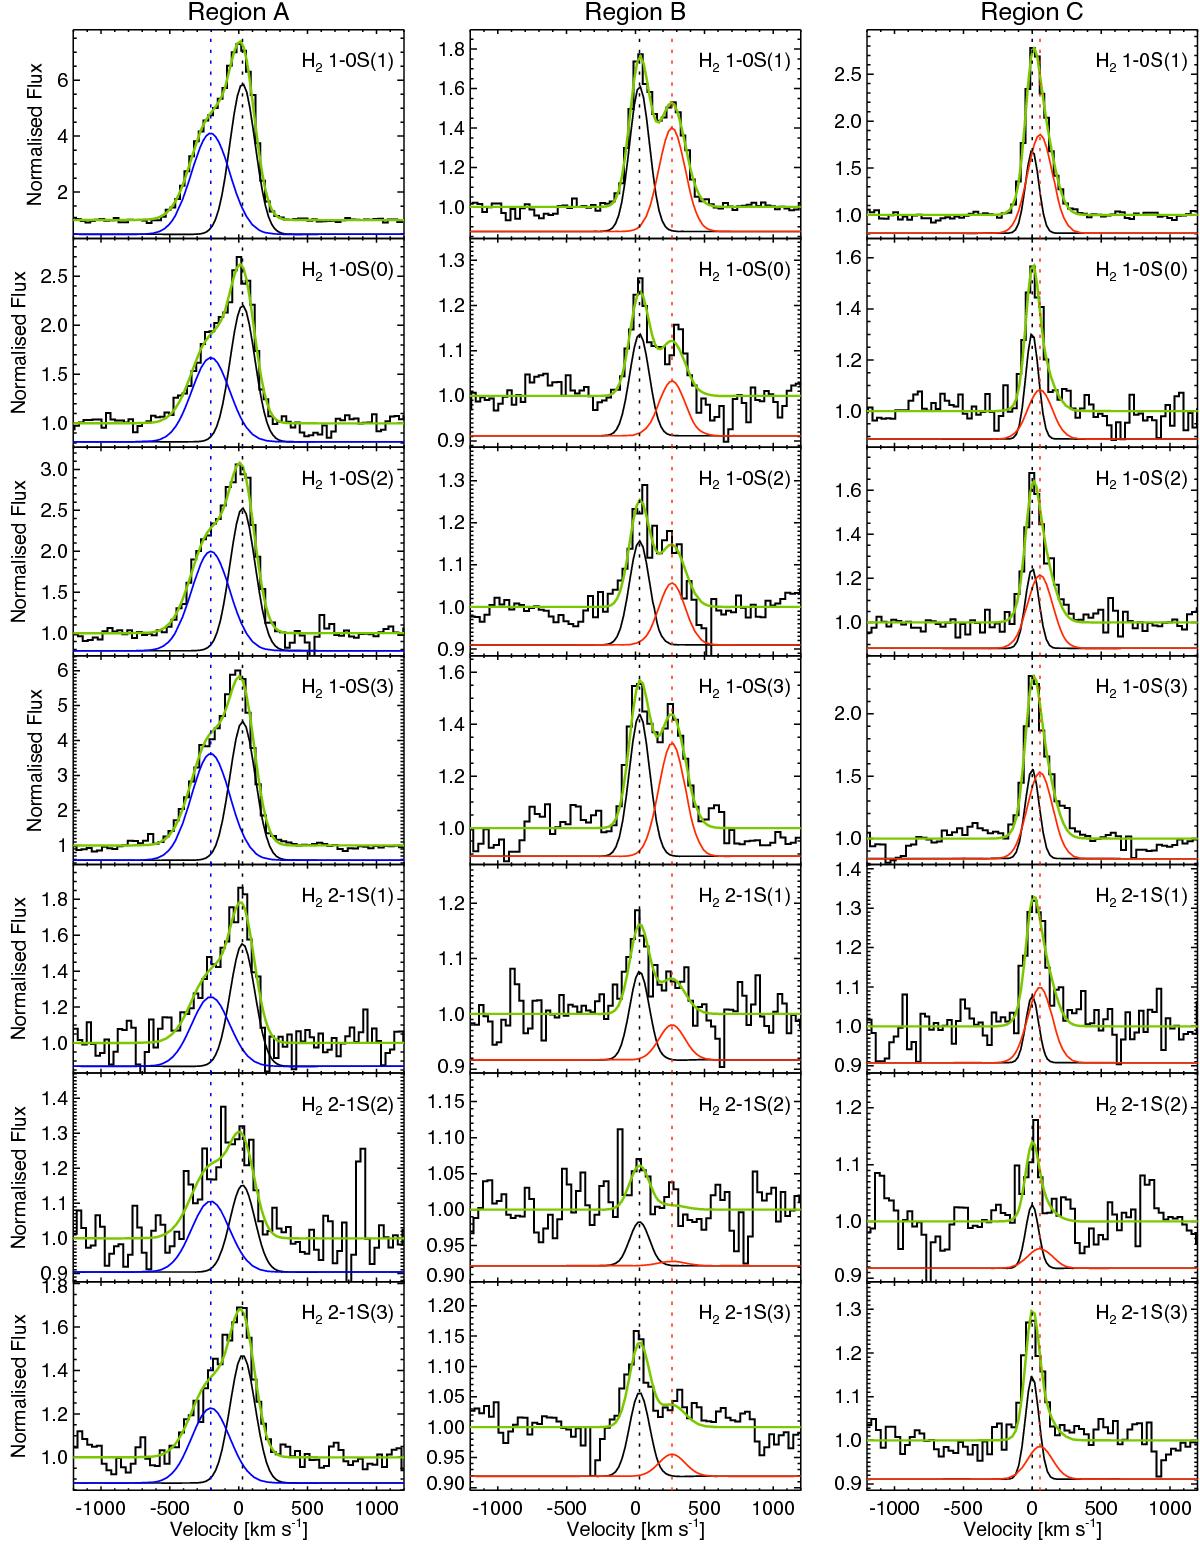
Emission-line spectra and 2-component Gaussian fit of the various H2 transitions in regions A, B and C. The spectra were extracted from a circular aperture of 13 spaxels, centered on the broad-component H2 feature in each region. The line width and shift between the peak of the narrow and broad component were constrained in velocity to those of the strong 1−0 S(1) line. A straight line was fitted to the continuum across a wide velocity range of −1800 to +1800 km s-1 in order to handle potential features in the continuum (see, e.g., the H2 1−0S(3) transition in region B). However, a smaller velocity range is plotted in the figures to high-light the details of the fits to the emission lines. After extracting flux measurements, for visualisation purposes the spectra in the plots were normalized to the fitted continuum.
Current usage metrics show cumulative count of Article Views (full-text article views including HTML views, PDF and ePub downloads, according to the available data) and Abstracts Views on Vision4Press platform.
Data correspond to usage on the plateform after 2015. The current usage metrics is available 48-96 hours after online publication and is updated daily on week days.
Initial download of the metrics may take a while.