Fig. 6
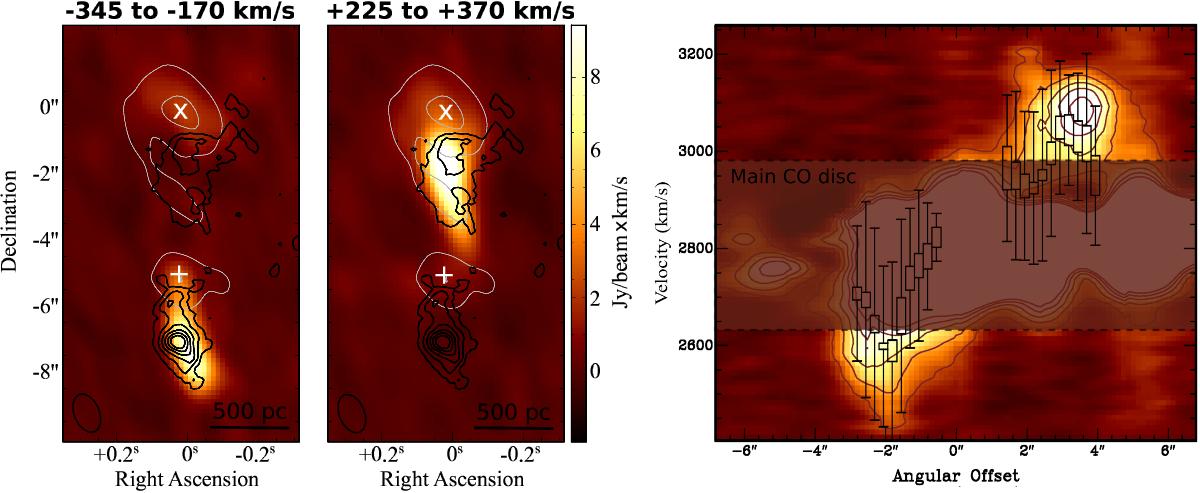
Total intensity map of the blueshifted (left) and redshifted (middle) high-velocity CO(3−2) emission in ALMA observations of NGC 3256. The velocity range of the integrated CO(3−2) emission is given in the plots. Overlaid are thick black contours of the broad-component H2 flux from Fig. 1 (levels from 14% to 80% in steps of 13% of the peak flux), as well as thin gray contours of the 343 GHz radio continuum from the ALMA data (levels at 3 and 10 mJy beam-1; for details see Sakamoto et al. 2014). The relative astrometry between the SINFONI and ALMA data has an estimated uncertainty of ~ 0.5′′. Right: position-velocity (PV) diagram of the high-velocity CO(3−2) emission along a north-south direction crossing the secondary nucleus at offset = 0″ (optical velocity definition; contours 20, 40, 60, 80, 100 mJy beam-1). Overlaid are black symbols that represent the broad-component H2 emission along the same direction (i.e., the NS-aperture from Fig. 1); the box shows the range between the average and maximum value per resolution element (1.1′′ × 0.25′′), while the error bars indicate ± 0.5 × FWHMaverage. The complex region of the main CO disk is not discussed (see Sakamoto et al. 2014).
Current usage metrics show cumulative count of Article Views (full-text article views including HTML views, PDF and ePub downloads, according to the available data) and Abstracts Views on Vision4Press platform.
Data correspond to usage on the plateform after 2015. The current usage metrics is available 48-96 hours after online publication and is updated daily on week days.
Initial download of the metrics may take a while.