Fig. 5
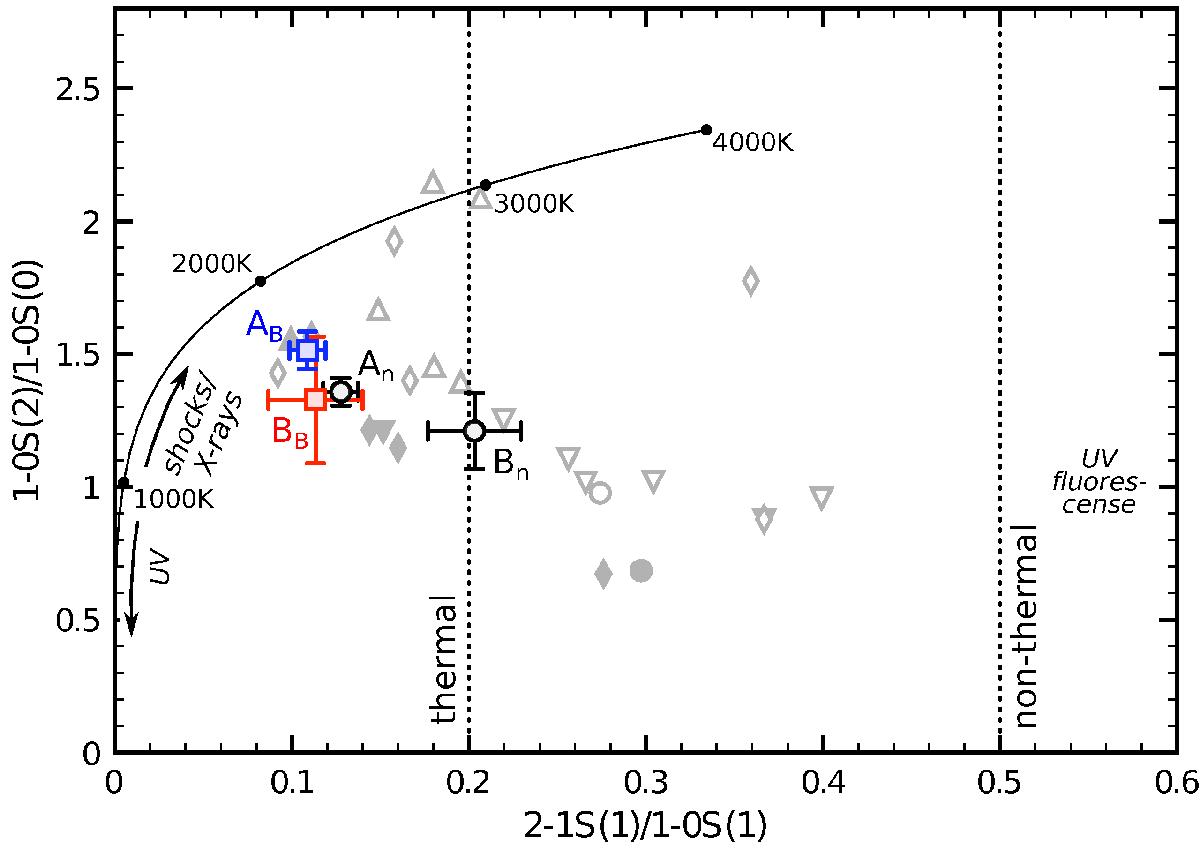
H2 line ratio diagram for the blueshifted broad component in region A (blue square), the redshifted broad component in region B (red square) and the narrow components in regions A and B (black circles). The solid black line shows the expected line ratios for uniform density gas that is in local thermal equilibrium (LTE), with excitation temperatures indicated. The dotted lines provide an indication for the regions where the 2−1 S(1)/1−0 S(1) line ratio is caused by thermal (≲0.2) and non-thermal (≳0.5) conditions, based values from models that are summarized in Mouri (1994). The regions where these models predict UV photons (Sternberg & Dalgarno 1989), shocks/X-rays (Brand et al. 1989; Lepp & McCray 1983; Draine & Woods 1990; Dors et al. 2012) and UV-fluorescence (Black & van Dishoeck 1987) to dominate the gas excitation are indicated in more detail. Open gray symbols represent values from individual regions studied within other nearby galaxies (starforming regions, rings, arcs, clouds, etc.), with closed gray symbols the nuclei of these systems. Diamonds are from Mazzalay et al. (2013), downward pointing triangles from Falcón-Barroso et al. (2014), upwards pointing triangles from Bedregal et al. (2009) and circles from Piqueras López et al. (2012b). See also Ramos Almeida et al. (2009) and Riffel et al. (2013) for studies performed on integrated near-IR long-slit spectra of various types of galaxies.
Current usage metrics show cumulative count of Article Views (full-text article views including HTML views, PDF and ePub downloads, according to the available data) and Abstracts Views on Vision4Press platform.
Data correspond to usage on the plateform after 2015. The current usage metrics is available 48-96 hours after online publication and is updated daily on week days.
Initial download of the metrics may take a while.