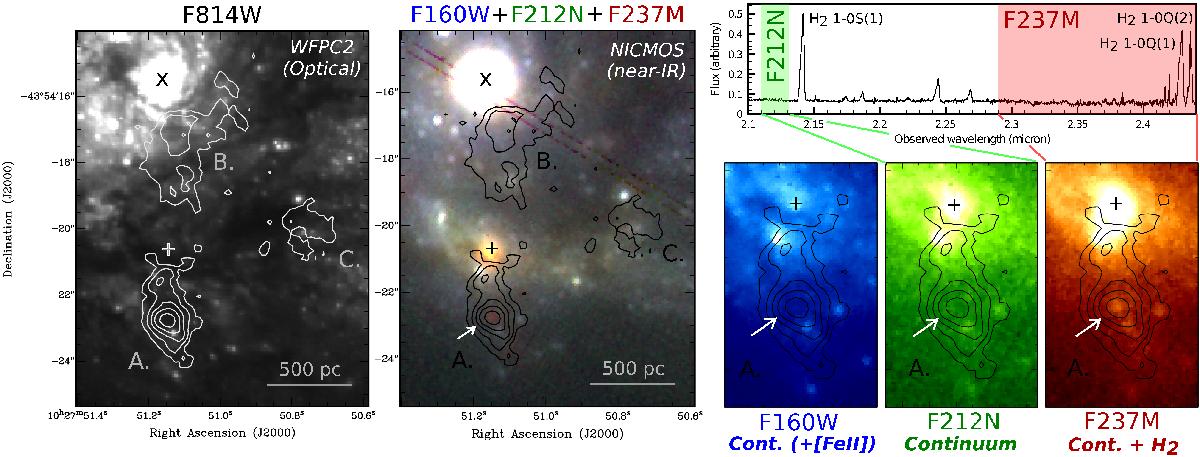
Fig. 3

Left: contours of the broad-component H2 emission from Fig. 1 (levels: 0.7, 1.3, 2.0, 2.8, 4.0 × 10⁻¹⁷ erg s-1 cm-2) overlaid onto an optical image taken with the HST/WFPC2 F814W724−878 nm wide-band filter. Middle: contours of the broad-component H2 emission overlaid onto a 3-color near-IR image of the same region taken with the HST/NICMOS2 (filters: blue = F160W1.4−1.8 μm, green = F212N2.111−2.132 μm, red = F237M2.29−2.44 μm). Top right: VLT/SINFONI spectrum obtained against the region of peak H2 emission in region A (aperture 13 pixels). Visualized are the regions of the HST/NICMOS F212N narrow-band (2.111−2.132 μm) and F237M medium-band filter (2.29−2.44 μm). The F237M filter includes the prominent H2 1−0 Q(1) and Q(2) lines. The F160W wide-band filter (1.4−1.8 μm) covers the VLT/SINFONI H-band spectrum of this object, with [Fe II] as the most prominent emission-line in this spectral region (see Piqueras López et al. 2012a). Right bottom: region A as observed in the three different NICMOS filters. The arrows point to the region with enhanced H2 emission in both the VLA/SINFONI and HST/NICMOS F237M data.
Current usage metrics show cumulative count of Article Views (full-text article views including HTML views, PDF and ePub downloads, according to the available data) and Abstracts Views on Vision4Press platform.
Data correspond to usage on the plateform after 2015. The current usage metrics is available 48-96 hours after online publication and is updated daily on week days.
Initial download of the metrics may take a while.


