Fig. 1
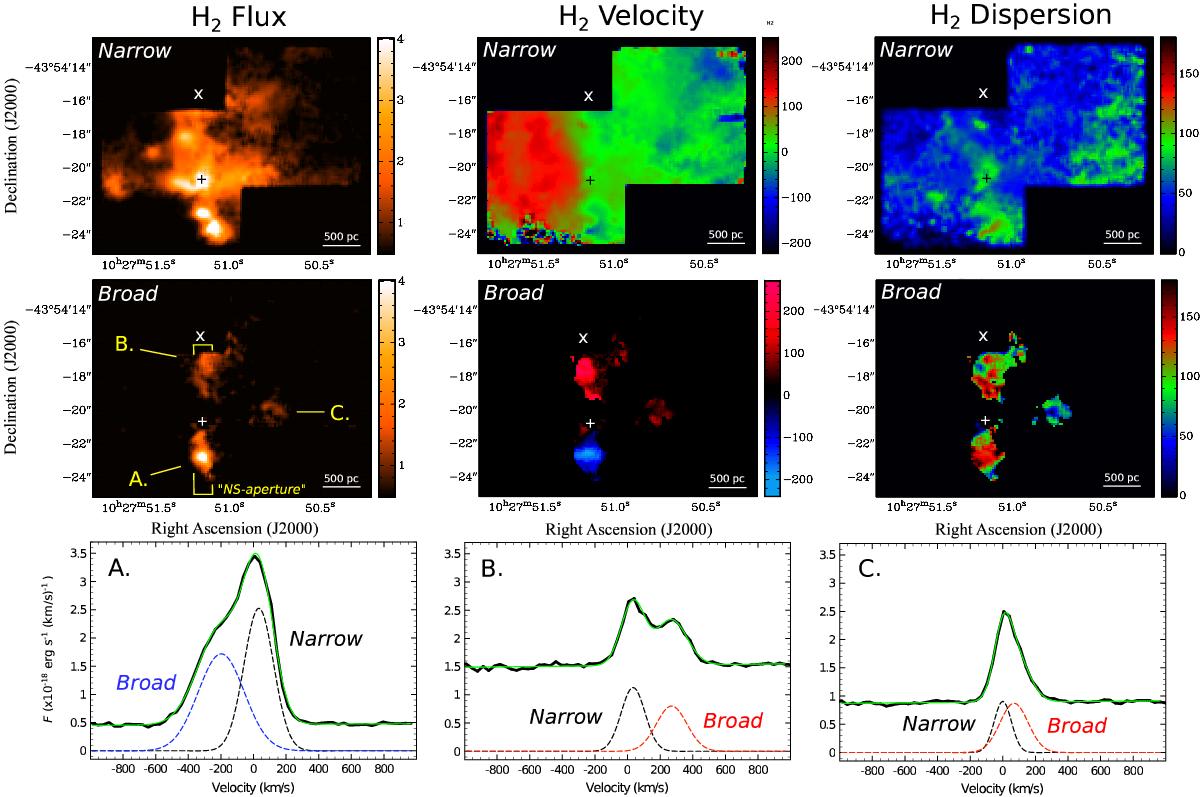
SINFONI view of the H2 emission in NGC 3256, mostly covering the region surrounding the secondary (southern) nucleus. The primary and secondary nucleus are marked with an × and +, respectively, and are shown in more detail in Fig. 3. Top + middle: maps of the H2 flux (F), velocity of the emission-line peak (v) and velocity dispersion (σ = FWHM/ 2.35, with FWHM the full width at half the maximum intensity) of both the narrow- (top) and broad-component gas (middle). Velocities are with respect to z = 0.009354 as per Piqueras López et al. (2012a), which is the assumed systemic velocity of the secondary core (Sect. 1.1). Units are in × 10-17 erg s-1 cm-2 (F) and km s-1 (v and σ). Bottom: H2 emission-line profiles, plus continuum-subtracted 2-component Gaussian fit, in regions A, B and C. The spectra were extracted from a circular aperture of 13 spaxels of 0.125′′ × 0.125′′ each (i.e., roughly the size of the seeing disk), centered on the broad-component H2 features.
Current usage metrics show cumulative count of Article Views (full-text article views including HTML views, PDF and ePub downloads, according to the available data) and Abstracts Views on Vision4Press platform.
Data correspond to usage on the plateform after 2015. The current usage metrics is available 48-96 hours after online publication and is updated daily on week days.
Initial download of the metrics may take a while.