Fig. 4
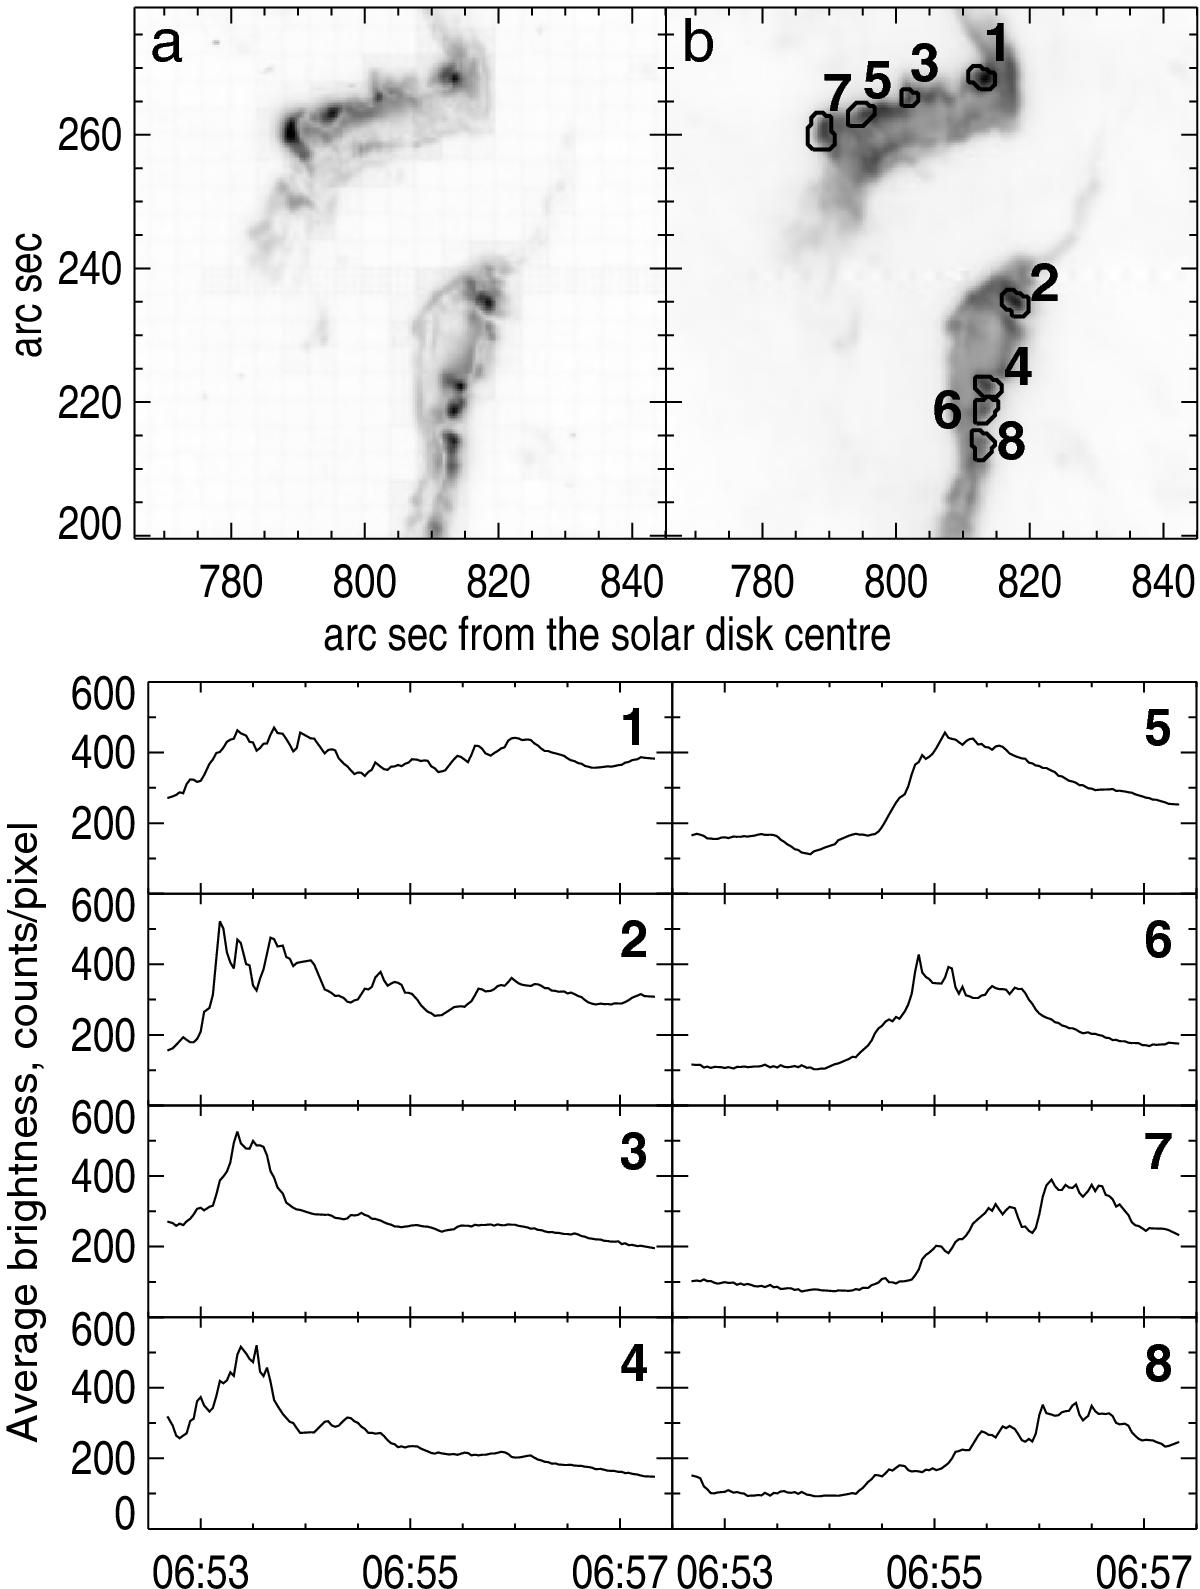
Flare ribbons and flare kernels (TRACE 160 nm) during the impulsive and early post-impulsive phases of the 2005 Jan. 20 flare. Top: maps of the variance of the emission a) showing the flare kernels and of the average emission b), showing the flare ribbons, with overlaid flare kernels as identified in the variance map (50% contour; see text). The axes are labelled in arc seconds from disk centre. Bottom: time profiles of the individual kernels, numbered as in map b). Odd-numbered kernels are in the northern ribbon, even-numbered ones in the southern ribbon. Successive odd and even numbers denote conjugate kernels.
Current usage metrics show cumulative count of Article Views (full-text article views including HTML views, PDF and ePub downloads, according to the available data) and Abstracts Views on Vision4Press platform.
Data correspond to usage on the plateform after 2015. The current usage metrics is available 48-96 hours after online publication and is updated daily on week days.
Initial download of the metrics may take a while.