Open Access
Fig. 3
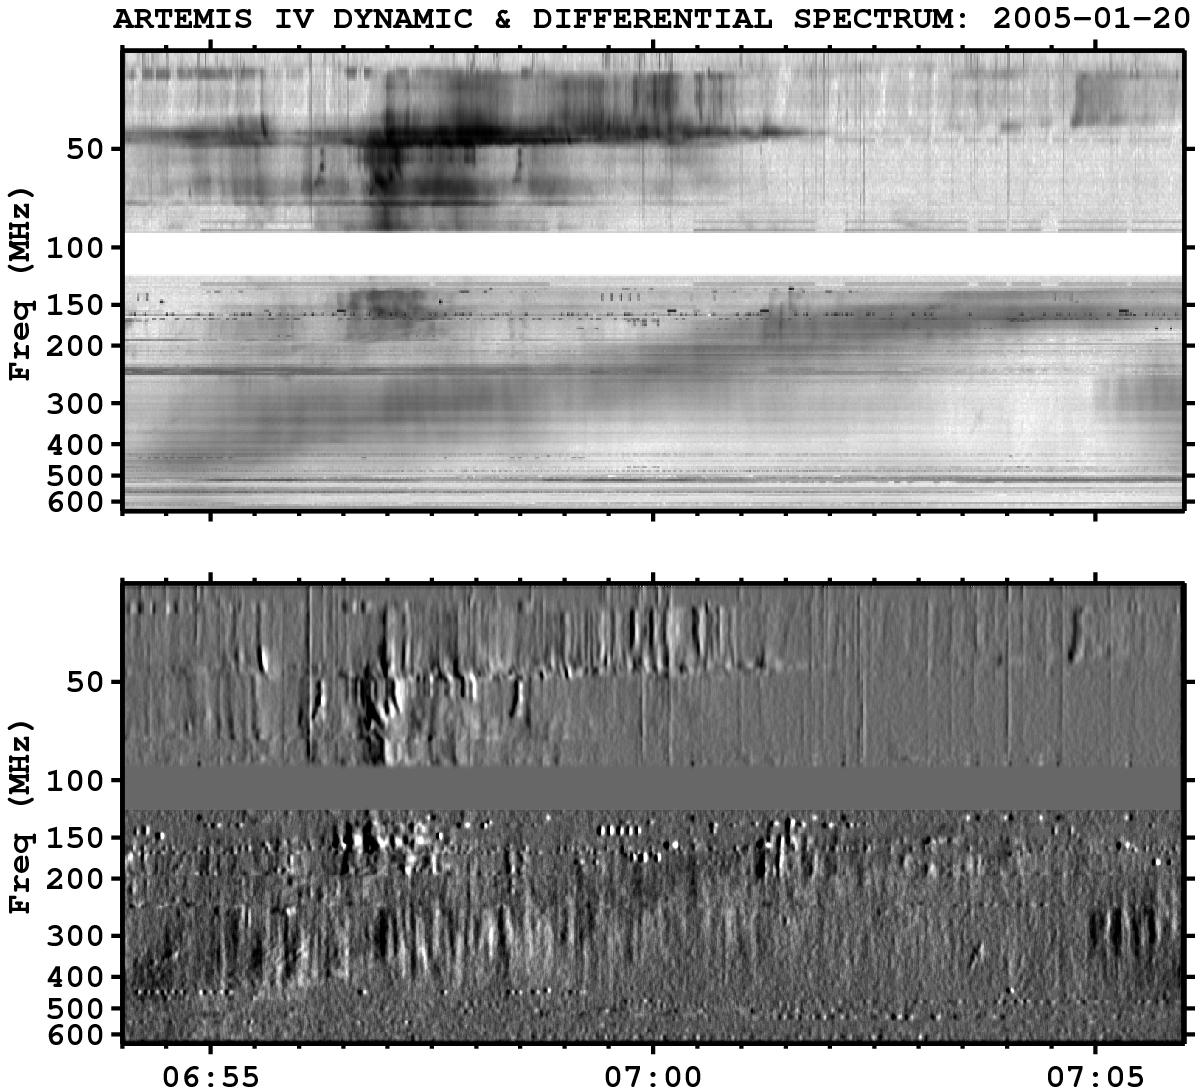
Detail of the dynamic spectrum (ARTEMIS IV; top; inverse grey-level scale) and differential spectrum (bottom) during the narrowband drifting lane in Episode 5. The vertical axis gives the frequency in MHz. The series of dark spots near the low-frequency border of the total flux density spectrum is an instrumental artefact.
Current usage metrics show cumulative count of Article Views (full-text article views including HTML views, PDF and ePub downloads, according to the available data) and Abstracts Views on Vision4Press platform.
Data correspond to usage on the plateform after 2015. The current usage metrics is available 48-96 hours after online publication and is updated daily on week days.
Initial download of the metrics may take a while.