Fig. 2
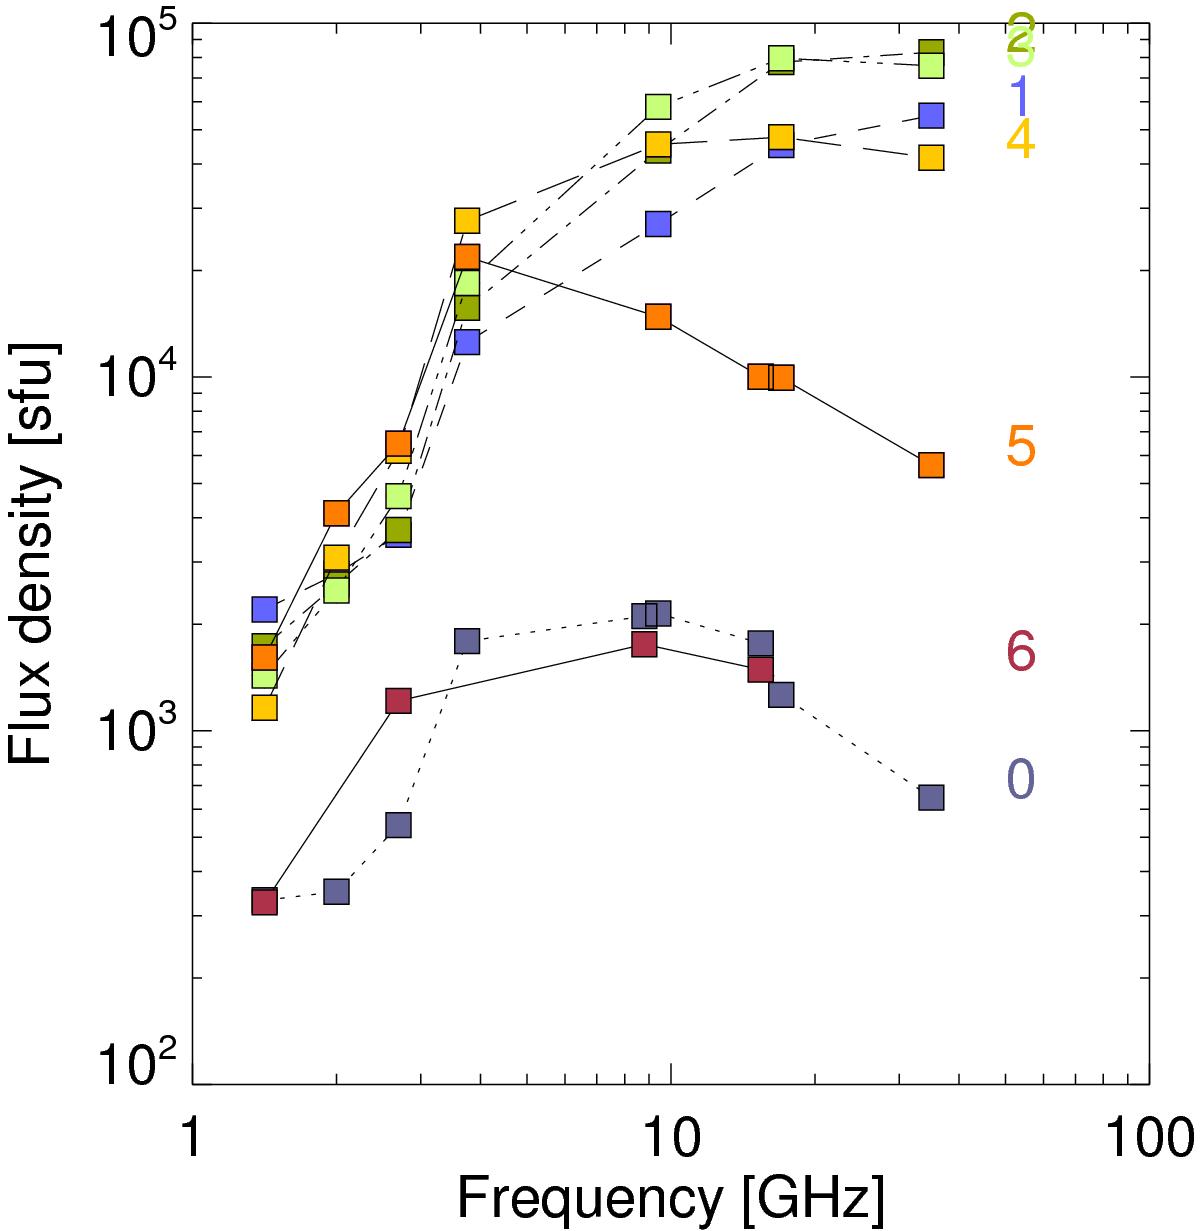
Whole Sun radio spectra during the different acceleration episodes, as indicated to the right of the curves. Each spectrum is an average over 1 min taken at the midpoint of the acceleration episode. Data compiled from the Learmonth RSTN station (1.4, 2.7 GHz during the entire burst, 8.8 GHz during Episodes 0 and 6, and 15.4 GHz during Episodes 0, 5, 6) and the Nobeyama Radio Polarimeters (2, 3.75, 9.4, 17, and 35 GHz, Episodes 0−5). The flux density (ordinate) is given in solar flux units (1 sfu = 10-22 W m-2 Hz-1).
Current usage metrics show cumulative count of Article Views (full-text article views including HTML views, PDF and ePub downloads, according to the available data) and Abstracts Views on Vision4Press platform.
Data correspond to usage on the plateform after 2015. The current usage metrics is available 48-96 hours after online publication and is updated daily on week days.
Initial download of the metrics may take a while.