Fig. 1
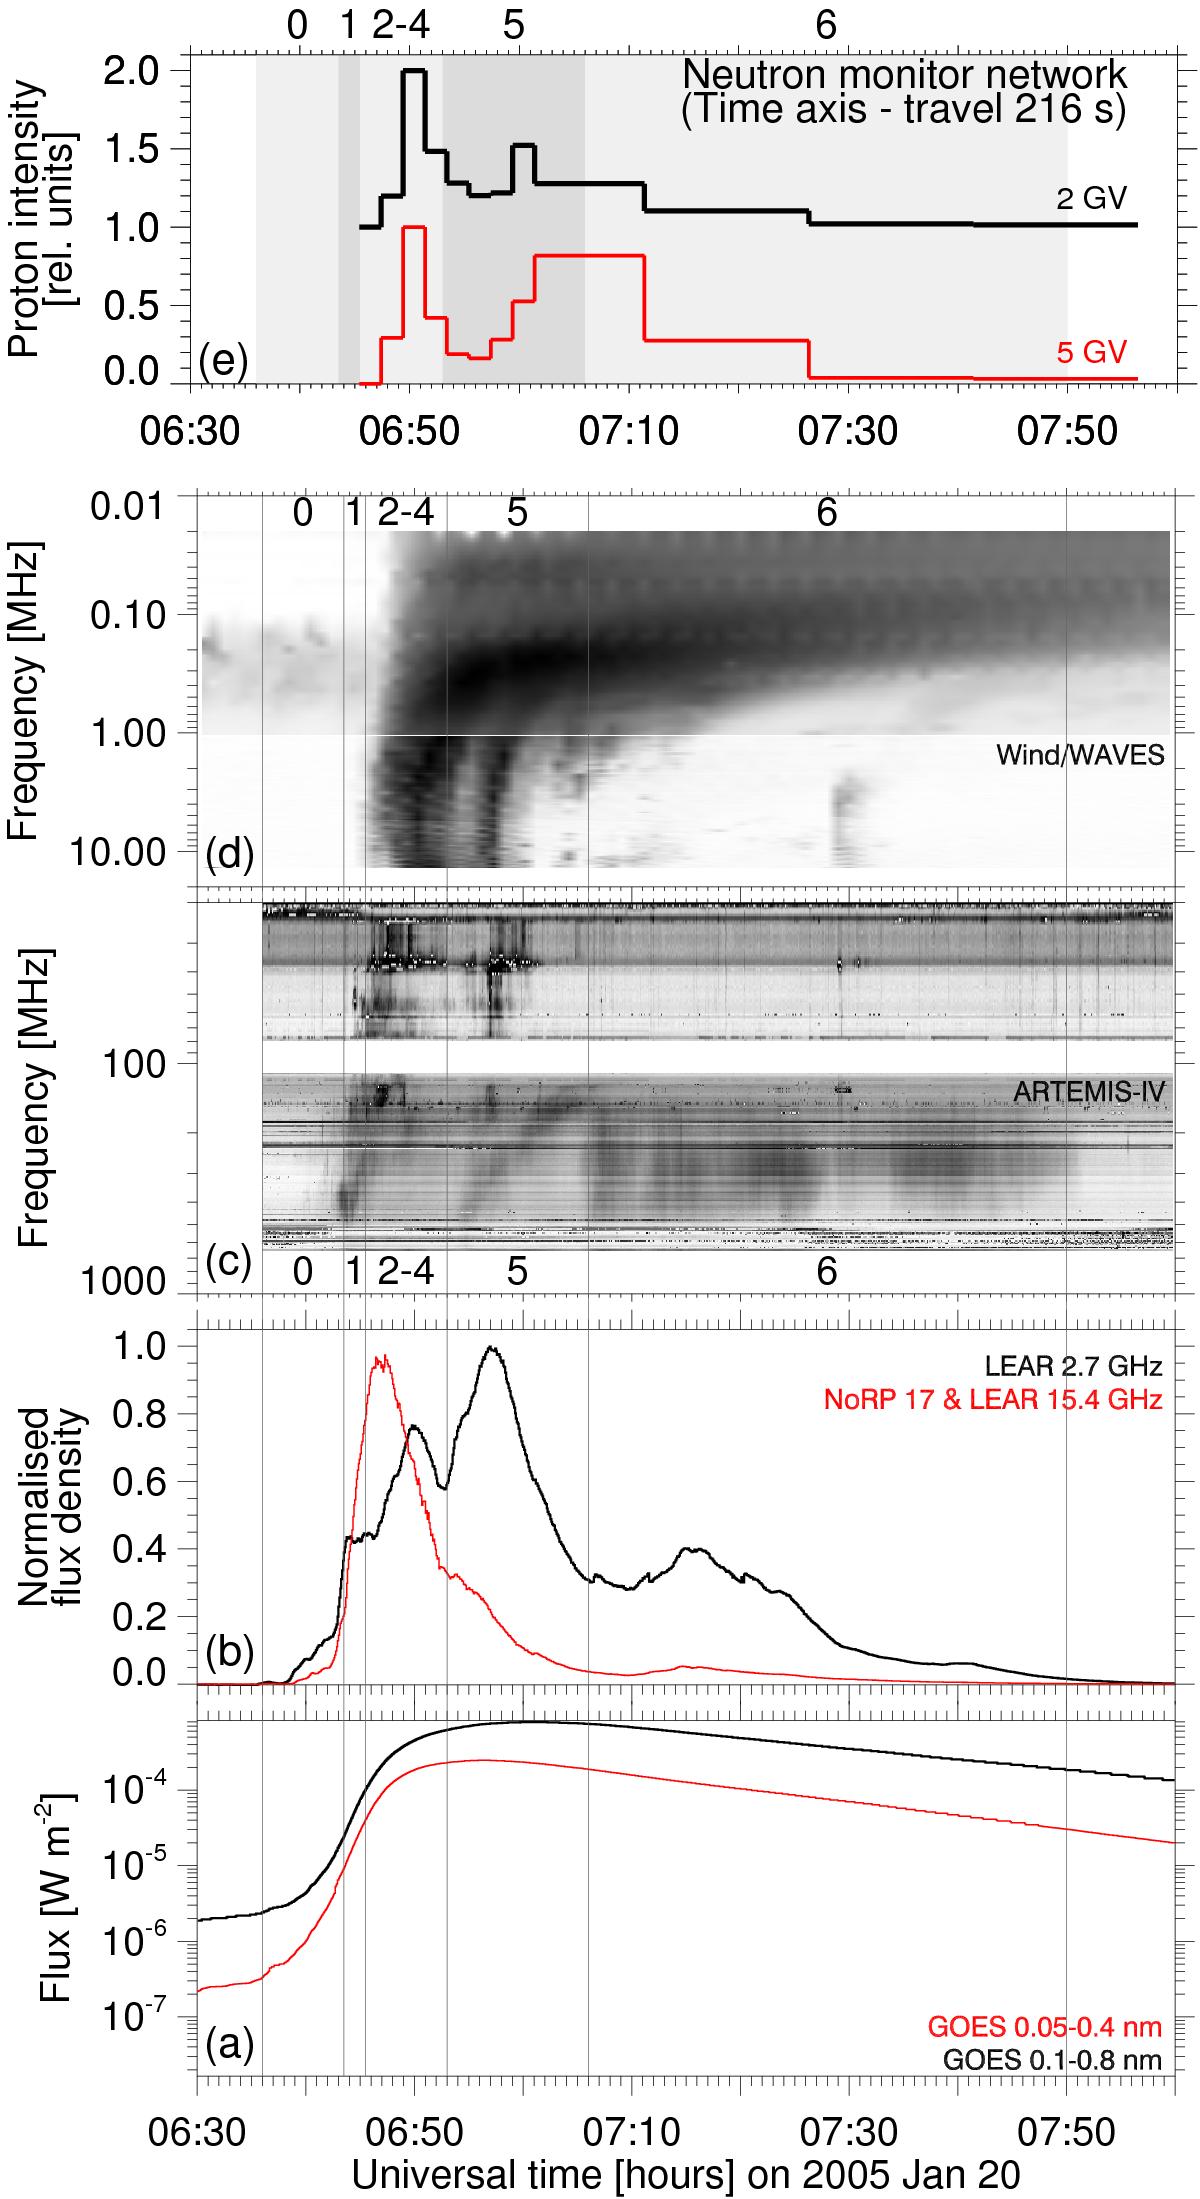
X-ray and radio emission and the relativistic proton profile of the 2005 Jan. 20 event. From bottom to top: a) soft X-rays λ = 0.1−0.8 nm (dark line) and 0.05−0.4 nm (light; red in the colour plot of the online version); b) microwaves (dark line 2.7 GHz, light – red in the colour display – a combination of 17 GHz (NoRP) before and 15.4 GHz (LEAR) after 06:55 UT); c) dynamic radio spectrum at dm-m waves (ARTEMIS-IV; inverse colour scale; 1 s integration time); d) decametre-kilometre wave radio emission (Wind/WAVES; inverse colour scale; 1 min integration); e) proton flux time history at 2 GV (dark curve) and 5 GV (light curve; red in the online version) rigidity (kinetic energy 1.27 and 4.15 GeV, respectivelyy), time axis shifted back by 216 s. The intervals delimited by vertical lines and numbered 0 to 6 are different episodes of particle acceleration, as discussed in the text.
Current usage metrics show cumulative count of Article Views (full-text article views including HTML views, PDF and ePub downloads, according to the available data) and Abstracts Views on Vision4Press platform.
Data correspond to usage on the plateform after 2015. The current usage metrics is available 48-96 hours after online publication and is updated daily on week days.
Initial download of the metrics may take a while.