Free Access
Fig. 8
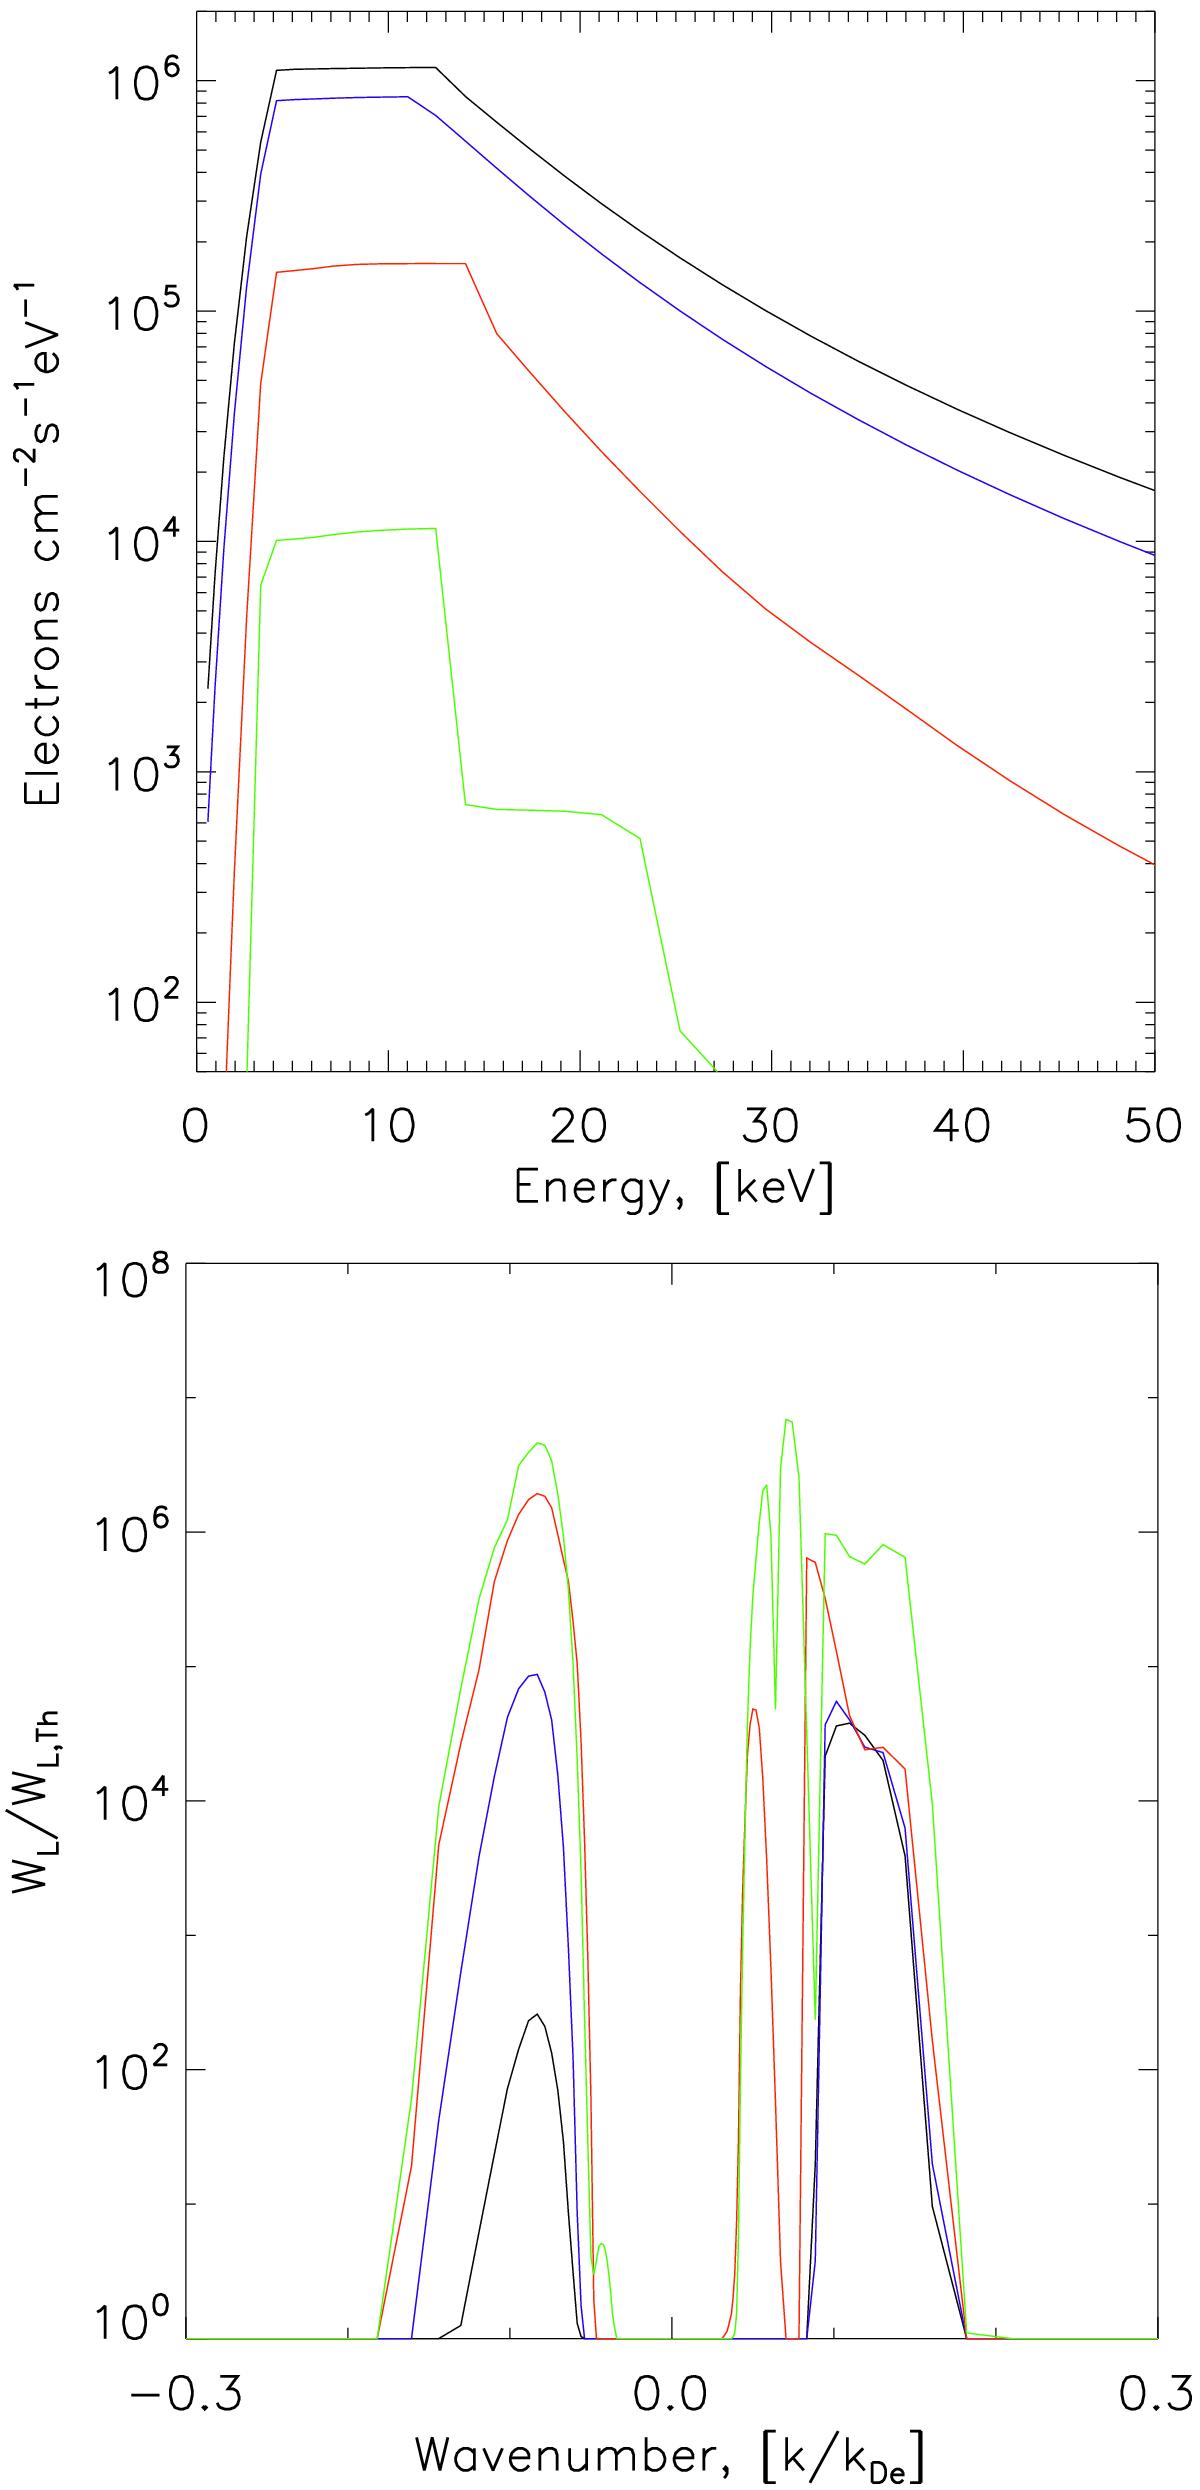
Electron flux as a function of energy (top) and Langmuir wave spectral energy density as a function of wavenumber normalised by the Debye wavenumber kDe (bottom) at a local plasma frequency of 100 (black), 75 (blue), 25 (red) and 5 MHz (green) at the time of peak EM emission (as given by Fig. 6).
This figure is made of several images, please see below:
Current usage metrics show cumulative count of Article Views (full-text article views including HTML views, PDF and ePub downloads, according to the available data) and Abstracts Views on Vision4Press platform.
Data correspond to usage on the plateform after 2015. The current usage metrics is available 48-96 hours after online publication and is updated daily on week days.
Initial download of the metrics may take a while.