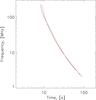
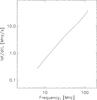
Fig. 6
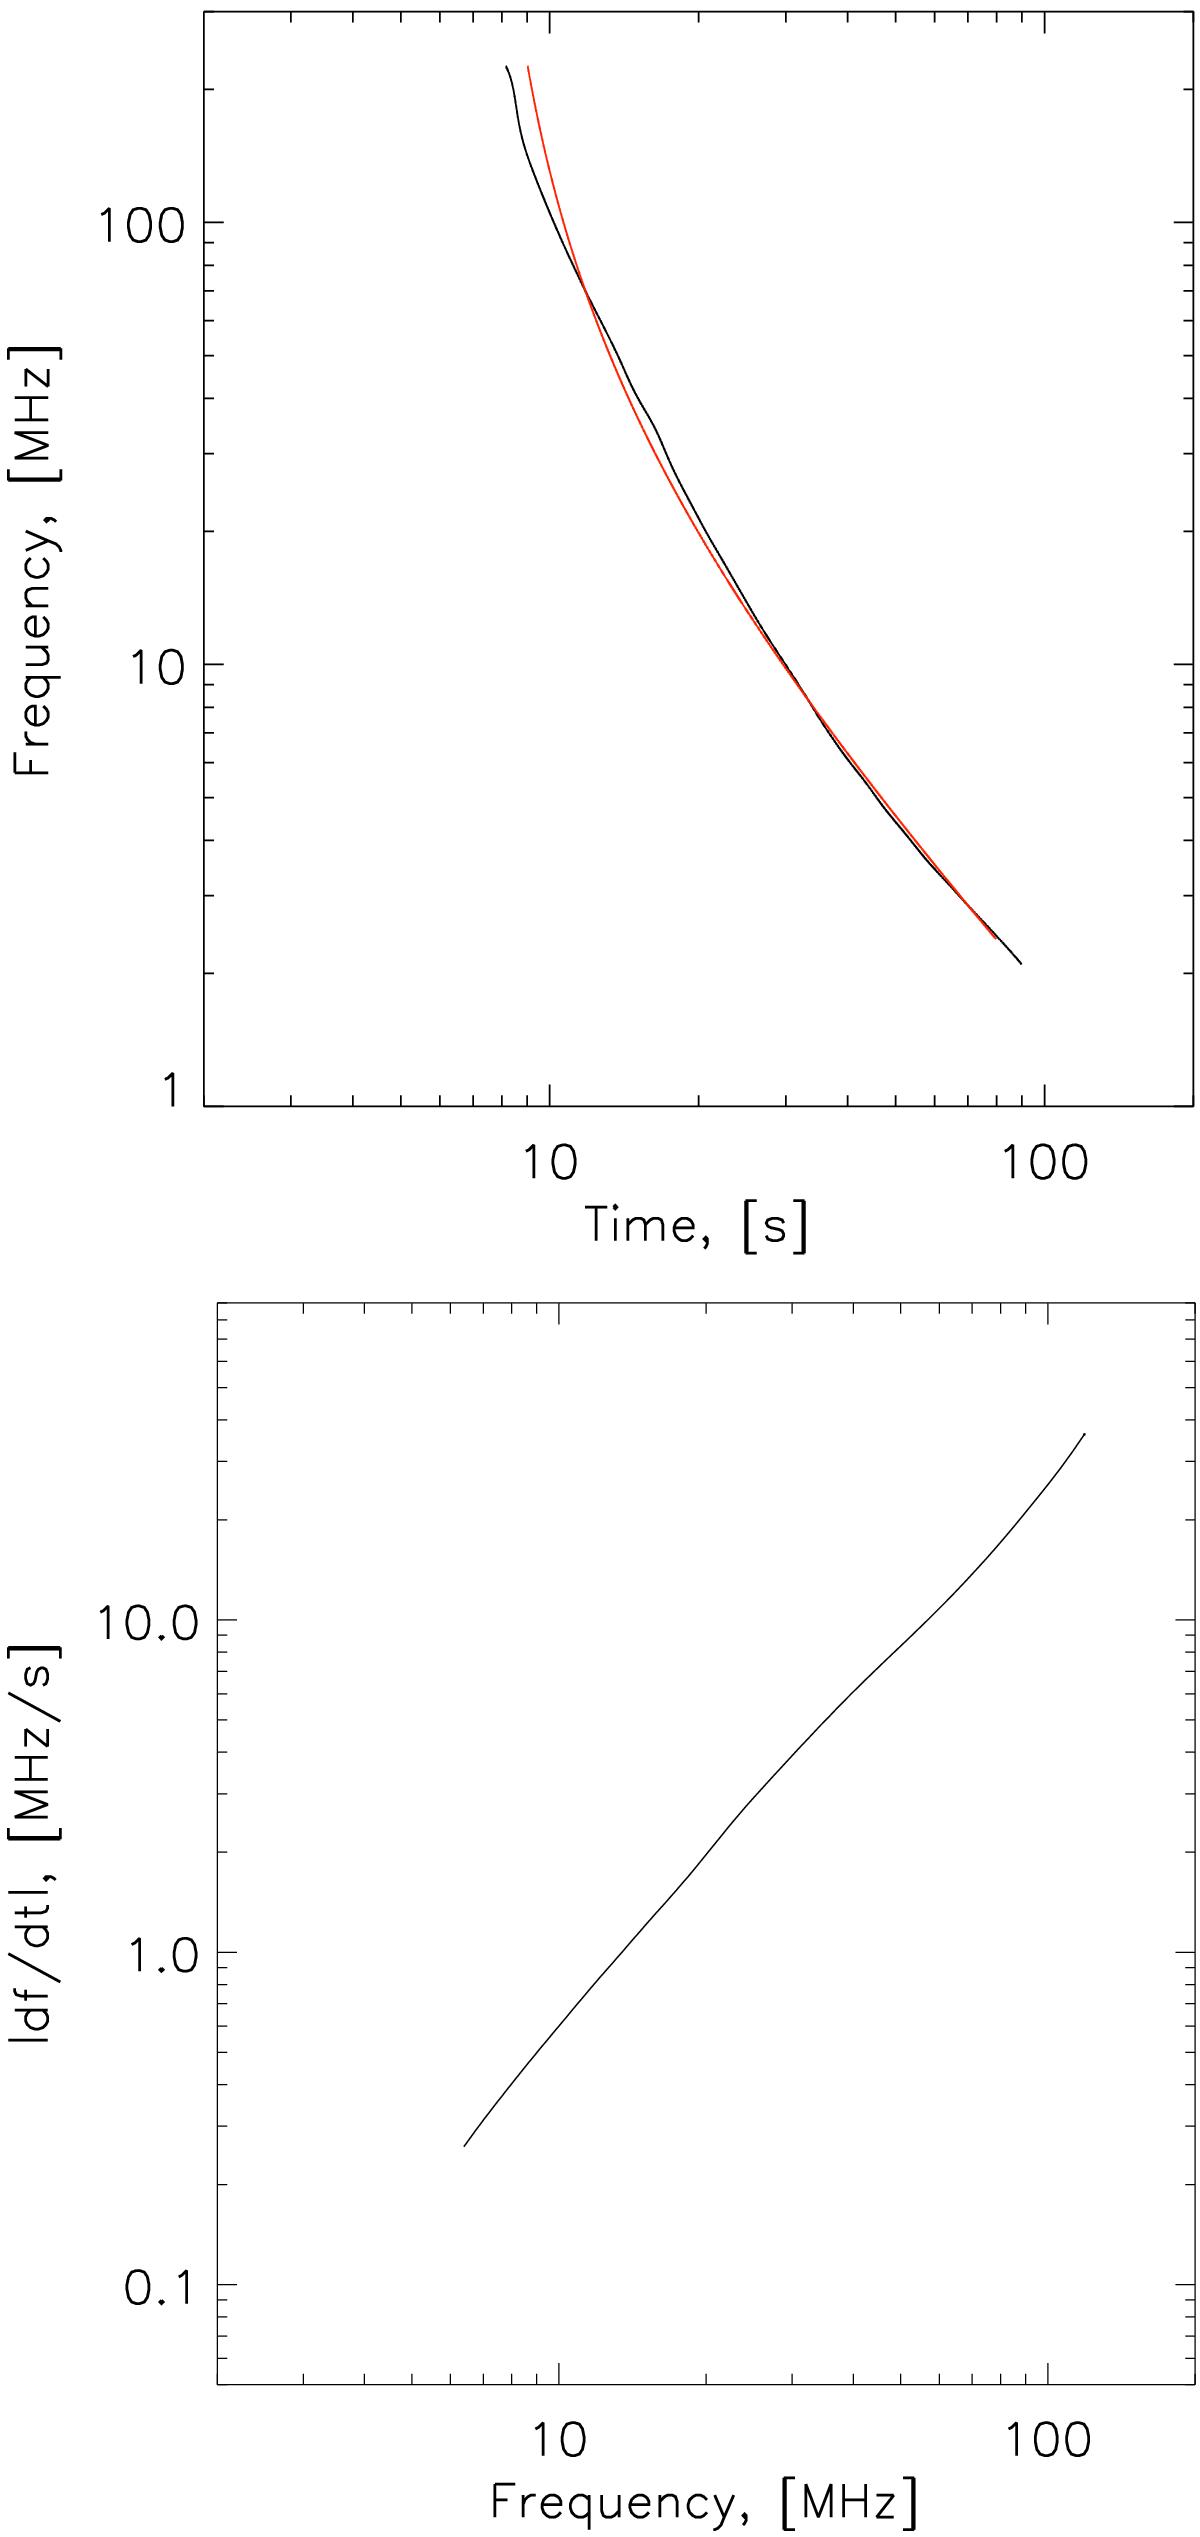
Top: peak emission frequency as a function of time. The red line is a single power-law fit of the form f = a(t − t0)b, where t0 accounts for the onset time of emission and we have a ≃ 150, b ≃ −0.6. Bottom: frequency drift rate, found by fitting power-laws to segments of the peak emission curve and differentiating these, as described in the text.
Current usage metrics show cumulative count of Article Views (full-text article views including HTML views, PDF and ePub downloads, according to the available data) and Abstracts Views on Vision4Press platform.
Data correspond to usage on the plateform after 2015. The current usage metrics is available 48-96 hours after online publication and is updated daily on week days.
Initial download of the metrics may take a while.