Fig. 4
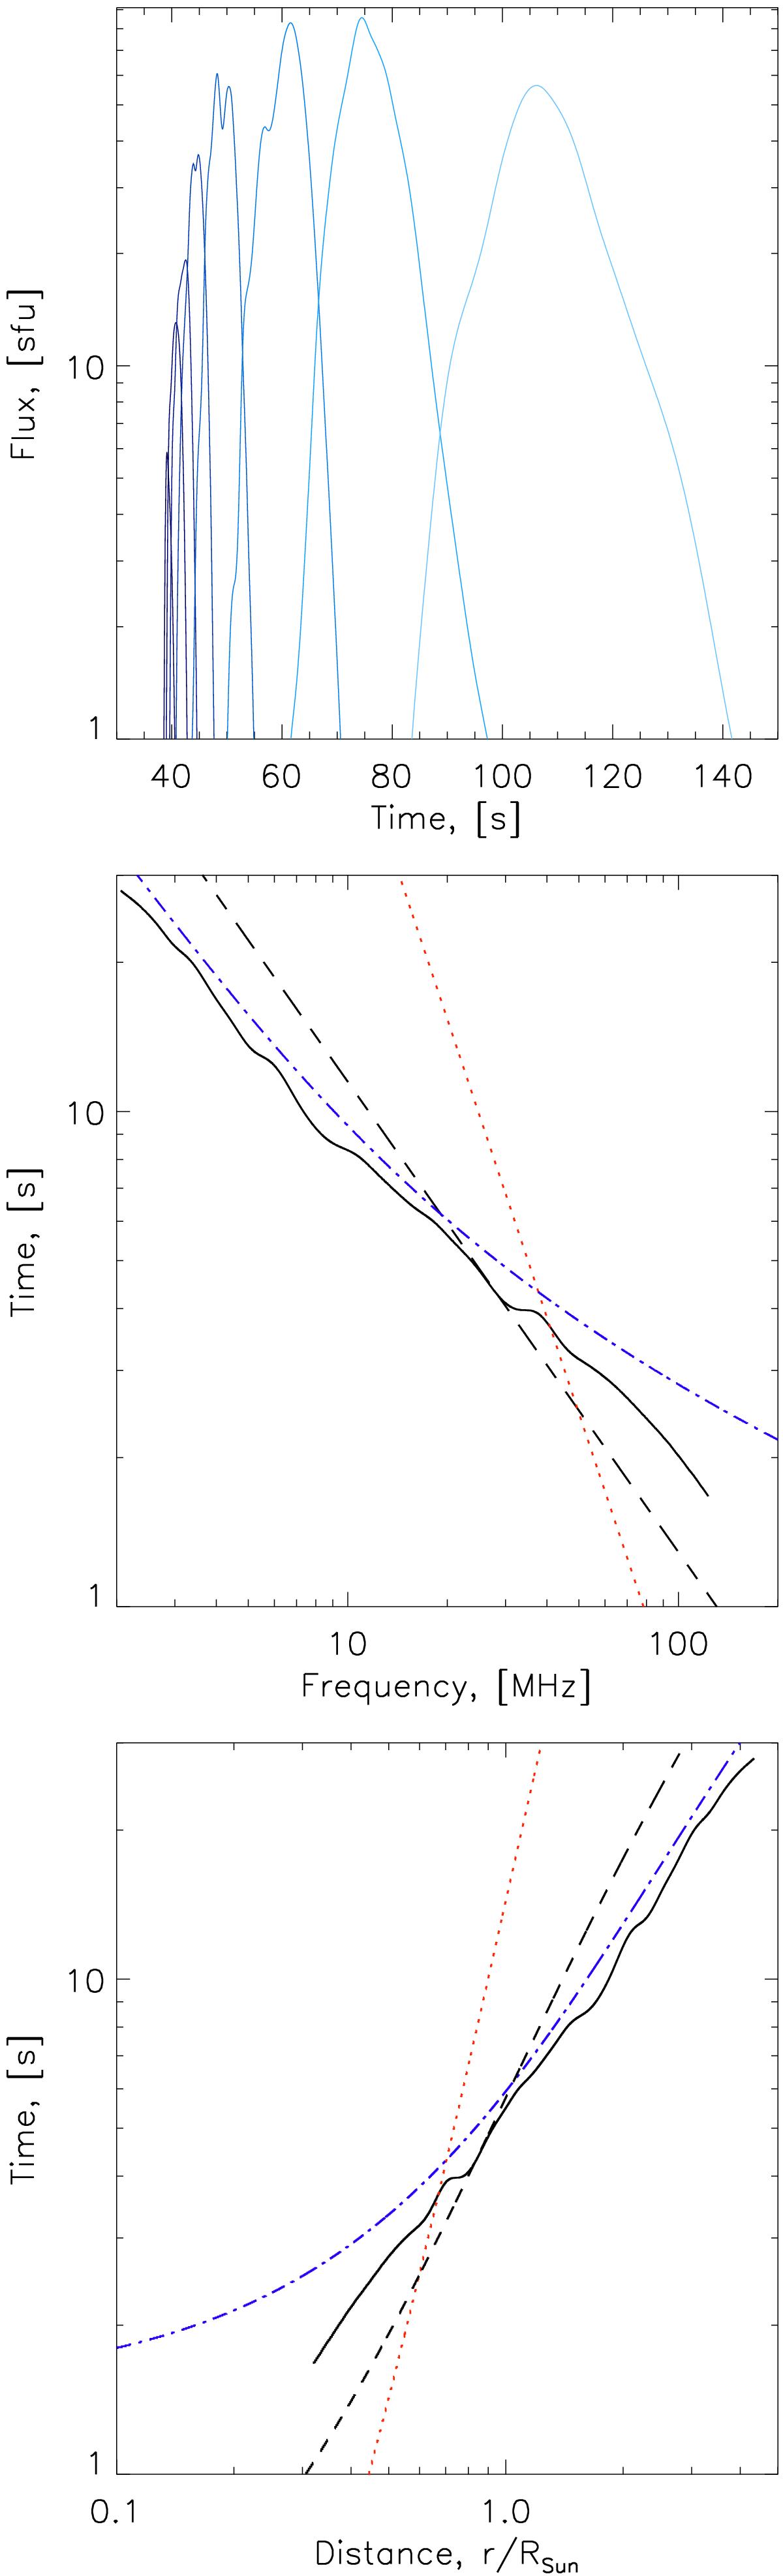
Top: radio emission time profiles at frequencies of 200, 150, 100, 75, 50, 25, 10, and 5 MHz (from dark to light blue) for a 1 s rise time of electron injection. Middle/Bottom: half-width-half-maximum of emission (black line), the collisional Langmuir wave decay time (Eq. (28), red dotted line), the timescale for Langmuir wave evolution due to plasma density inhomogeneity (Eq. (29), blue dot-dashed line) and the empirical result given by Eq. (27) (black dashed line), as a function of both background plasma frequency and distance from injection site.
Current usage metrics show cumulative count of Article Views (full-text article views including HTML views, PDF and ePub downloads, according to the available data) and Abstracts Views on Vision4Press platform.
Data correspond to usage on the plateform after 2015. The current usage metrics is available 48-96 hours after online publication and is updated daily on week days.
Initial download of the metrics may take a while.