Fig. 6
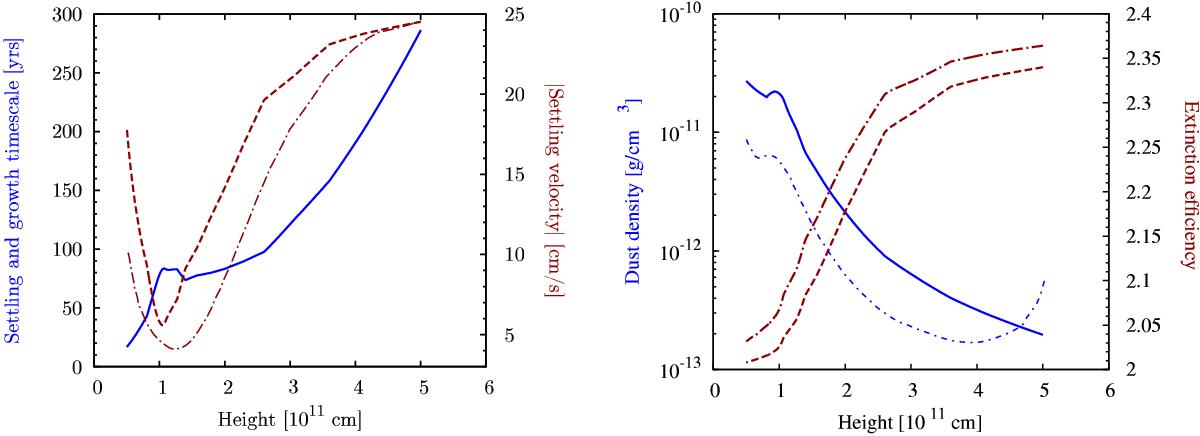
MP08 comparison case. Left panel: settling and by construction identical growth timescale in years (solid line) and settling velocity (dashed line) as a function of height. The thin dash-dotted line is the settling velocity found by MP08. As they only give the relative velocity vset(R) /vset(Rout), we have normalized their curve to the value predicted by the analytical model at Rout. Right panel: dust mass density (fD/G × ρ) found by the analytical model (blue solid line) and by MP08 (thin dash-dotted line). The two brown lines are the extinction efficiency, calculated with the fit of Eq. (54) (dashed) and directly with Mie theory (dash-dotted line).
Current usage metrics show cumulative count of Article Views (full-text article views including HTML views, PDF and ePub downloads, according to the available data) and Abstracts Views on Vision4Press platform.
Data correspond to usage on the plateform after 2015. The current usage metrics is available 48-96 hours after online publication and is updated daily on week days.
Initial download of the metrics may take a while.