Fig. 14
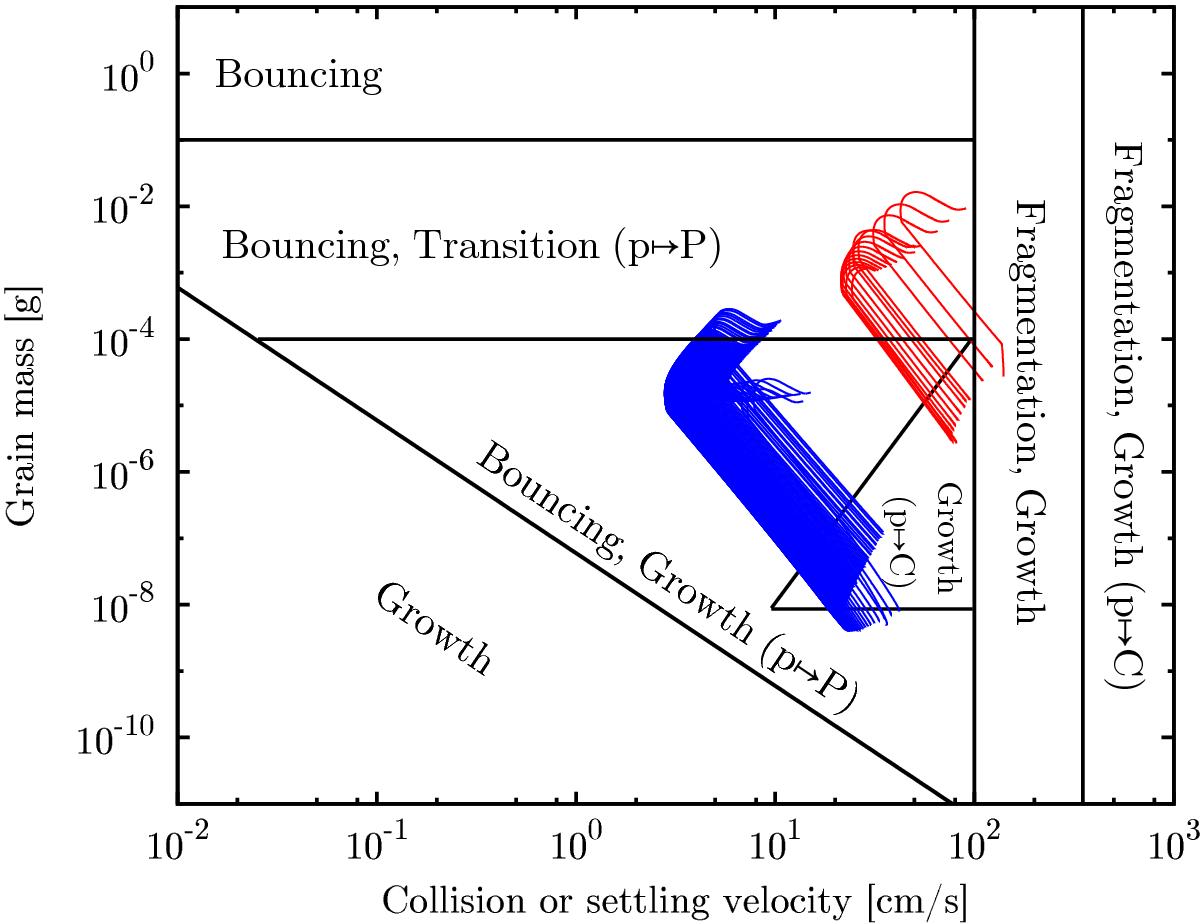
Overlay of the settling velocity-mass relation and the outcome of laboratory experiments on dust collisions. The red and blue lines show the settling velocity versus the grain mass in the radiative part of the atmosphere during phase II for the Σ10 and Σ4 case, respectively. For the Σ10 case, these are the same 12 structures shown in the right panel of Fig. 12. The black lines show in a simplified way the outcome of collision experiments (Güttler et al. 2010) in the collision velocity-grain mass plane. The actual outcome also depends on the grain porosity and the mass ratio of the projectile and target.
Current usage metrics show cumulative count of Article Views (full-text article views including HTML views, PDF and ePub downloads, according to the available data) and Abstracts Views on Vision4Press platform.
Data correspond to usage on the plateform after 2015. The current usage metrics is available 48-96 hours after online publication and is updated daily on week days.
Initial download of the metrics may take a while.