Fig. 12
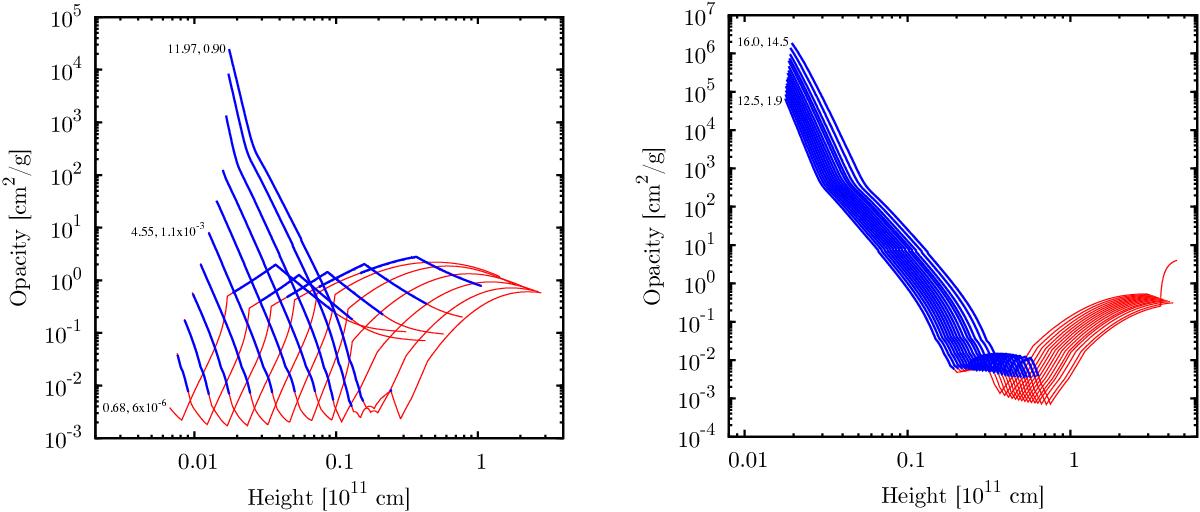
Temporal evolution of the radial profile of κ as a function of height (distance from the planet’s center) in the Σ10 simulation. The left end of the lines corresponds to the core-envelope boundary while the right end is the planet’s outer radius. Radiative layers are red, convective parts blue. The two numbers at the left give the corresponding core and envelope mass. The left panel shows the evolution during phase I. A sequence of 12 structures is shown, covering a time interval of 0.27 Myr. During this time the core mass increases from 0.6 M⊕ to 11.97 M⊕ while the envelope mass grows from 6 × 10⁻⁶M⊕ to 0.9 M⊕. The right panel shows the evolution during phase II. A sequence of 15 structures is shown, covering a time interval of 0.32 Myr. During this time the core mass increases from 12.5 M⊕ to 16 M⊕ while the envelope mass grows from 1.9 M⊕ to 14.5 M⊕. This last structure is the same as shown in Fig. 11 and thus occurs just before crossover. It is the only structure where the advection regime occurs in the top layers, leading to an increased opacity.
Current usage metrics show cumulative count of Article Views (full-text article views including HTML views, PDF and ePub downloads, according to the available data) and Abstracts Views on Vision4Press platform.
Data correspond to usage on the plateform after 2015. The current usage metrics is available 48-96 hours after online publication and is updated daily on week days.
Initial download of the metrics may take a while.