Fig. 1
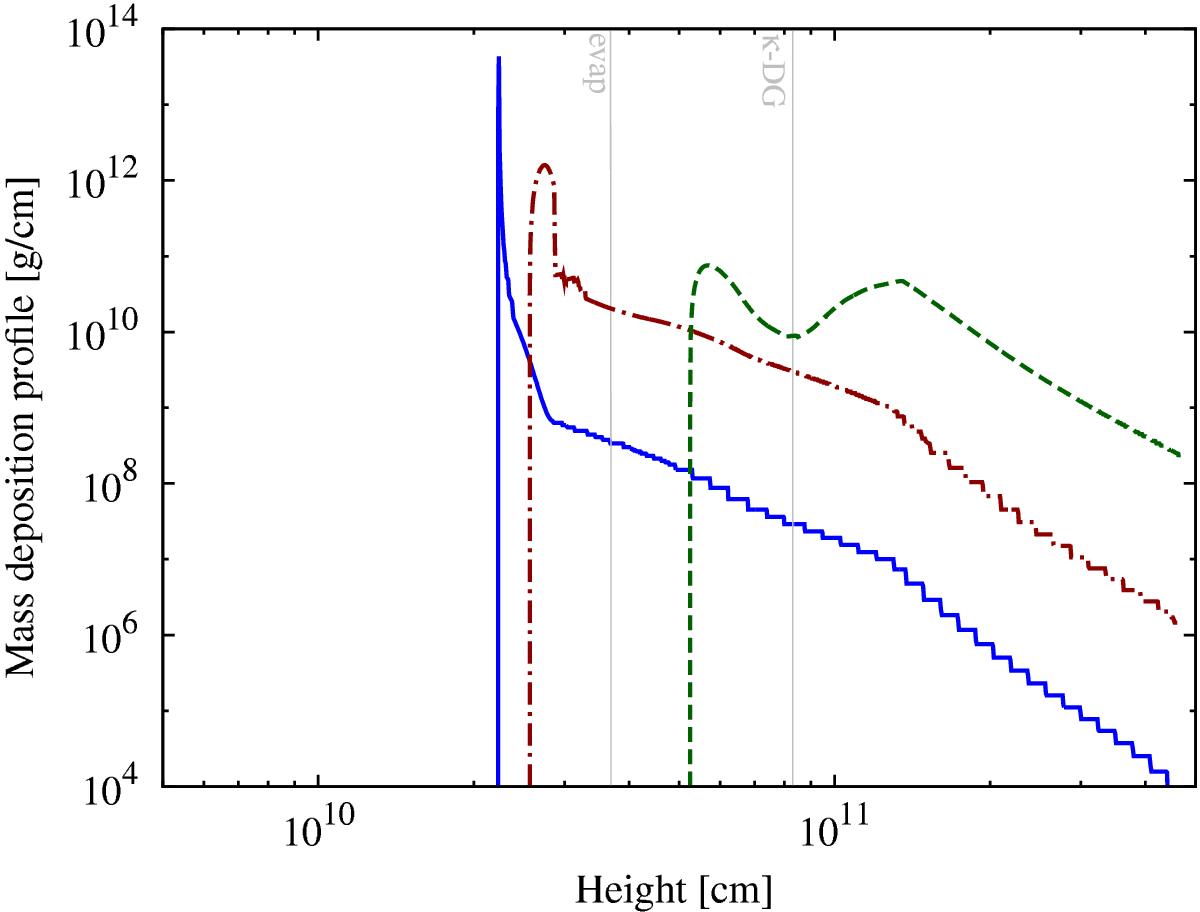
Mass deposition profile (ablated mass per unit length) as a function of height for 100 km planetesimals (solid blue line). The brown dash-dotted line is the mass deposition for 1 km planetesimals, multiplied by a factor 106, while the green dashed line shows the result for 10 m planetesimals, multiplied by a factor 1012, so that the total mass deposited is identical in the three cases. The gray vertical lines show the radius where the envelope temperature becomes so high that silicate grains evaporate (“evap”) and where the molecular opacities alone become larger than the opacity due to dust in the deep deposition case (“κ-DG”). The steps in the right part of the lines are a numerical artifact without physical meaning.
Current usage metrics show cumulative count of Article Views (full-text article views including HTML views, PDF and ePub downloads, according to the available data) and Abstracts Views on Vision4Press platform.
Data correspond to usage on the plateform after 2015. The current usage metrics is available 48-96 hours after online publication and is updated daily on week days.
Initial download of the metrics may take a while.