Fig. 10
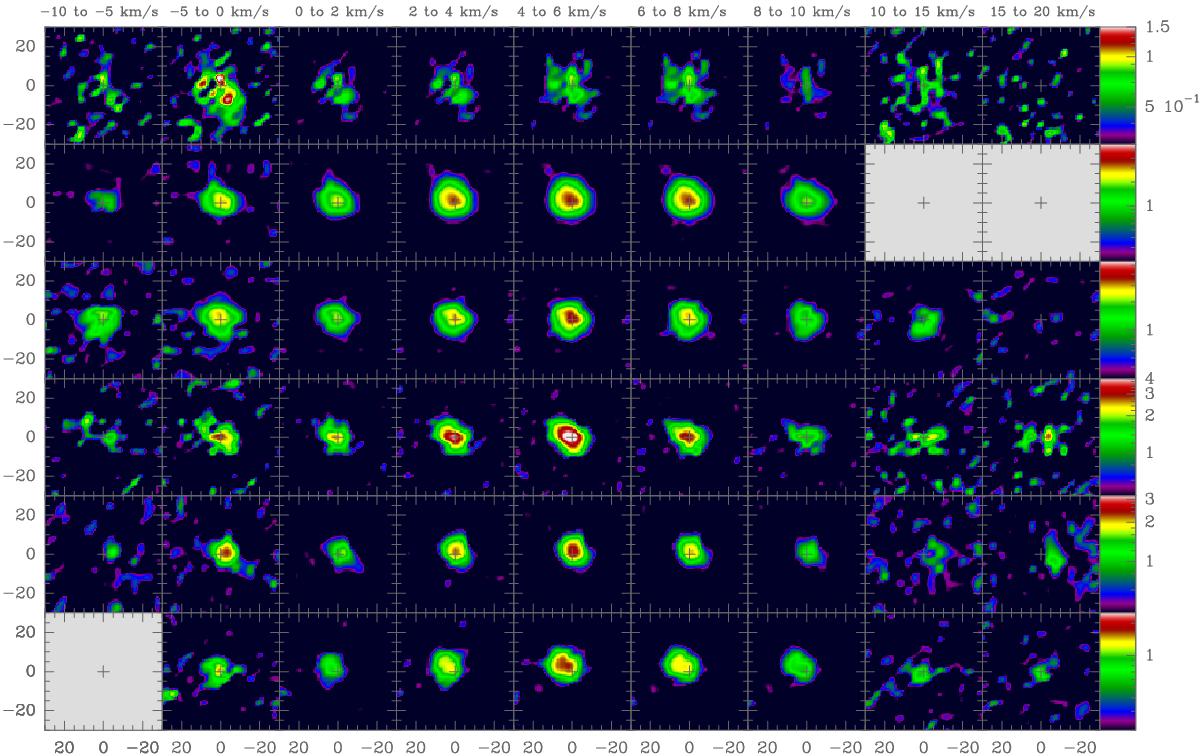
Integrated intensity maps for 6 ground state transitions of vinyl cyanide. From line 1 (top row) to 6 (bottom row): 121,12–111,11 (110 839.98 MHz, 36.8 K), 240,24–230,23 (221 766.03 MHz, 134.5 K), 242,23–232,22 (226 256.88 MHz, 144.8 K), 261,26–251,25 (238 726.808 MHz, 157.4 K), 262,25–252,24 (244 857.47 MHz, 167.9 K), and 2410,15–2310,14 and 2410,14–2310,13 (228017.34 MHz, 352.0 K) at different velocity ranges (indicated in the top of each column). Three boxes have been blanked because the emission at these velocities was blended with that from other well known species. For each box axis are in units of arcseconds (Δα, Δδ). Color logarithm scale is the integrated intensity (![]() dv) in units of K km s-1.
dv) in units of K km s-1.
Current usage metrics show cumulative count of Article Views (full-text article views including HTML views, PDF and ePub downloads, according to the available data) and Abstracts Views on Vision4Press platform.
Data correspond to usage on the plateform after 2015. The current usage metrics is available 48-96 hours after online publication and is updated daily on week days.
Initial download of the metrics may take a while.