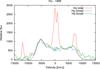
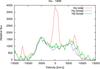
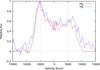
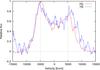
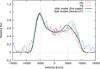
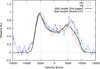
Fig. 7

Hα line profiles in 1988 (left panels) and 1999 (right panels). Upper panels: total Hα line (with narrow lines) compared with broad Hα and Hβ component (multiplied with the constant to match the Hα blue peak); middle panels: normalized broad Hα and Hβ component; bottom panels: disk models from this paper and Gezari et al. (2007).
Current usage metrics show cumulative count of Article Views (full-text article views including HTML views, PDF and ePub downloads, according to the available data) and Abstracts Views on Vision4Press platform.
Data correspond to usage on the plateform after 2015. The current usage metrics is available 48-96 hours after online publication and is updated daily on week days.
Initial download of the metrics may take a while.