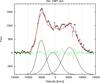
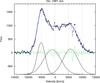
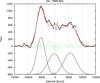
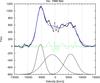
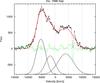
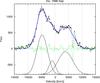
Fig. 5

Month-averaged Hα broad component fitted with Gaussians using two different assumptions: all parameters are free (left panels) and the shift of the central component is limited (right panels). Below the observed spectrum (dots), model (solid line), and residual (dashed line), the three broad Gaussian components are given. Each plot is labeled with the observed month and year.
Current usage metrics show cumulative count of Article Views (full-text article views including HTML views, PDF and ePub downloads, according to the available data) and Abstracts Views on Vision4Press platform.
Data correspond to usage on the plateform after 2015. The current usage metrics is available 48-96 hours after online publication and is updated daily on week days.
Initial download of the metrics may take a while.