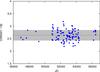
Fig. A.4
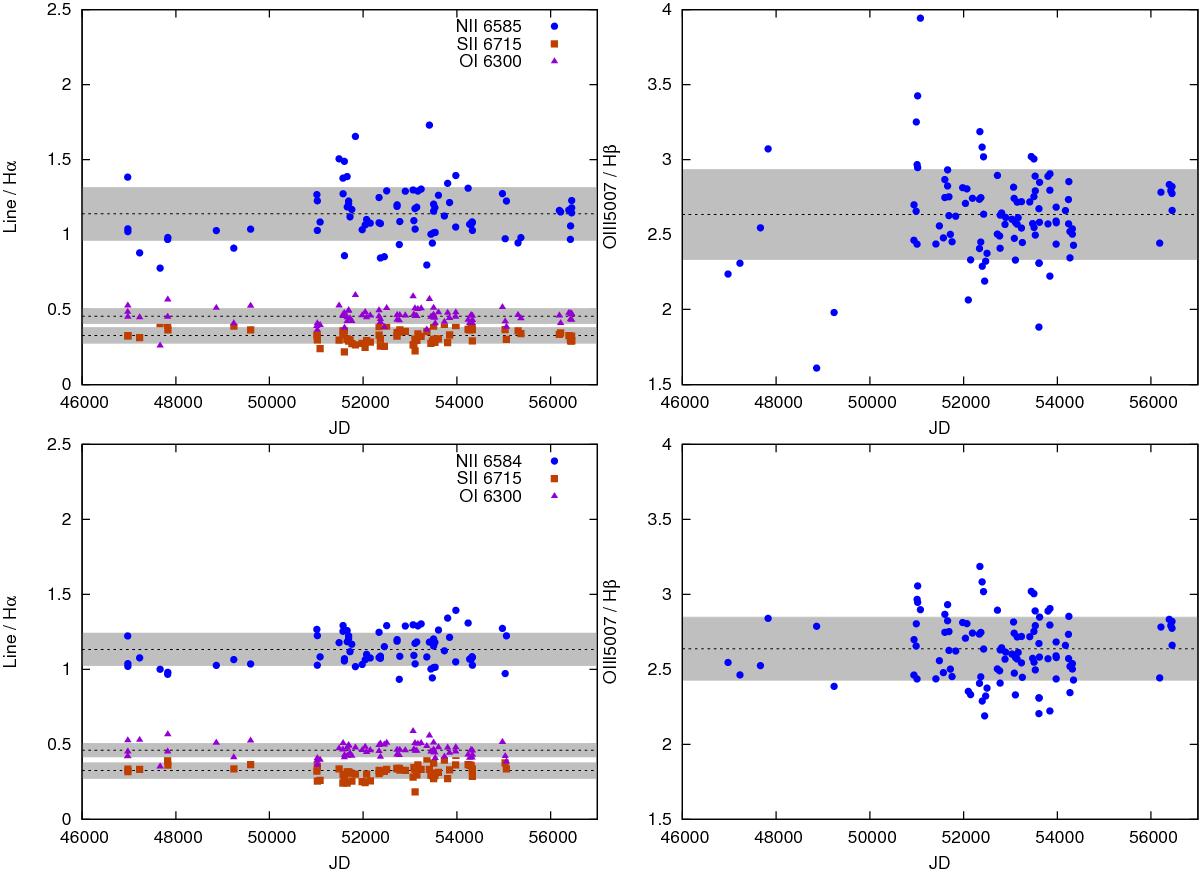
Ratio of the narrow emission line (labeled on plots) fluxes in the Hα (left panels) and Hβ (right panels) wavelength range during the monitored period. The narrow lines fluxes are calculated from the Gaussian fitting parameters as a sum of two components (one narrower fitting the line core and one broader fitting the line wings, see Sect. 2.2) The dashed lines with the shaded regions represent the mean value and the deviation of 10% from this. In upper panels, we obtained the ratios from the fit without any constraint, while in the bottom panels, the points with large scattering (from upper panels) have been corrected.
Current usage metrics show cumulative count of Article Views (full-text article views including HTML views, PDF and ePub downloads, according to the available data) and Abstracts Views on Vision4Press platform.
Data correspond to usage on the plateform after 2015. The current usage metrics is available 48-96 hours after online publication and is updated daily on week days.
Initial download of the metrics may take a while.