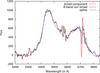
Fig. A.2
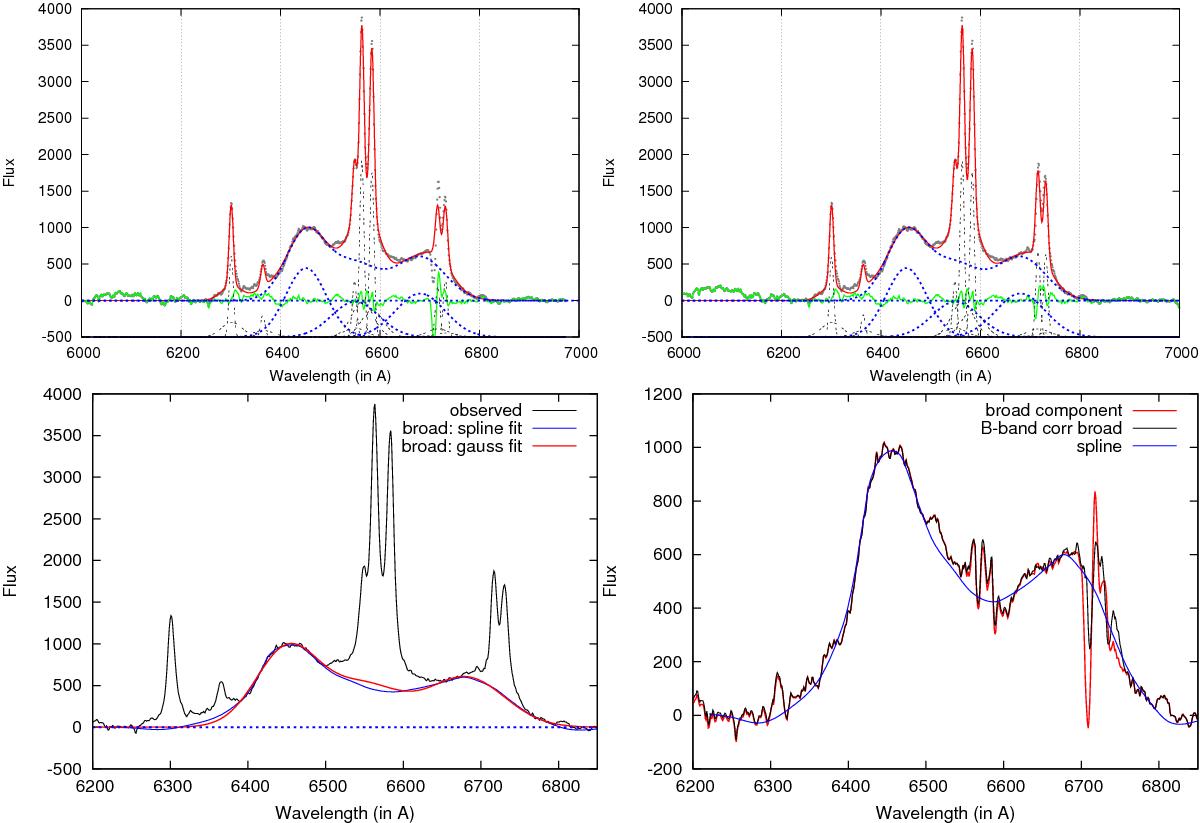
Multi-Gaussian fitting of the Hα wavelength range of the spectrum observed on Apr 02, 2003. Upper left: fitting of the spectra where the B-band absorption is not corrected. Upper right: the same except for the B-band corrected observed spectrum. In these two plots, the same Gaussians parameters (apart for the [SII] lines in which intensities are only increased) have been used. Bottom left: narrow lines removed using the DIPSO spline fitting of the broad component, compared with the 3-Gaussian broad-component fitting. Bottom right: comparison of the Hα broad component (after narrow lines subtraction) before and after the B-band absorption correction and the broad component obtained using the DIPSO spline fitting. The blue-peak position is the same, a slight difference is seen in the red peak.
Current usage metrics show cumulative count of Article Views (full-text article views including HTML views, PDF and ePub downloads, according to the available data) and Abstracts Views on Vision4Press platform.
Data correspond to usage on the plateform after 2015. The current usage metrics is available 48-96 hours after online publication and is updated daily on week days.
Initial download of the metrics may take a while.