Free Access
Fig. 5
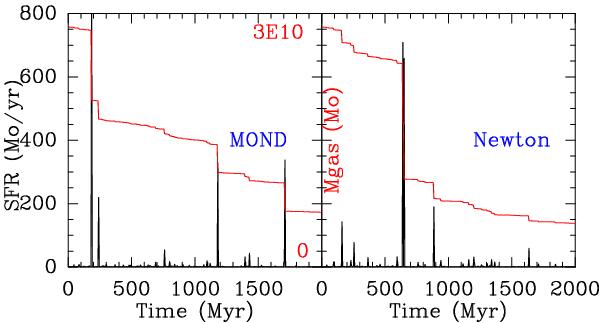
Evolution of the star formation rate (black line, left scale) and the remaining amount of gas (red lines and middle scale) in the giant galaxy, with MOND (left), and Newtonian dynamics (right).
Current usage metrics show cumulative count of Article Views (full-text article views including HTML views, PDF and ePub downloads, according to the available data) and Abstracts Views on Vision4Press platform.
Data correspond to usage on the plateform after 2015. The current usage metrics is available 48-96 hours after online publication and is updated daily on week days.
Initial download of the metrics may take a while.