Fig. 9
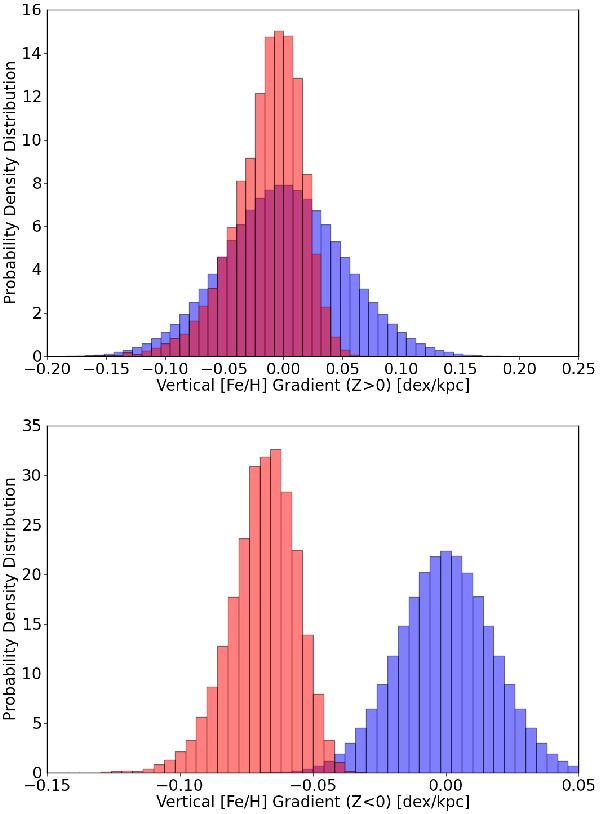
Top: normalized histogram of the vertical metallicity gradient for Z> 0 fields (red), shown in Fig. 7, and corresponding histogram (blue) of the permuted sample. The near complete overlap (0.27σ) between the two distributions indicates that the vertical metallicity gradient in the Z> 0 might as well be obtained by pure chance. Bottom: same as the top panel for the Z< 0 fields. The mean value of the observed distribution (red) is located at 3.82σ from the mean of the permuted sample, indicating that it is unlikely that the vertical metallicity gradient for Z< 0 was obtained by chance.
Current usage metrics show cumulative count of Article Views (full-text article views including HTML views, PDF and ePub downloads, according to the available data) and Abstracts Views on Vision4Press platform.
Data correspond to usage on the plateform after 2015. The current usage metrics is available 48-96 hours after online publication and is updated daily on week days.
Initial download of the metrics may take a while.