Fig. 3
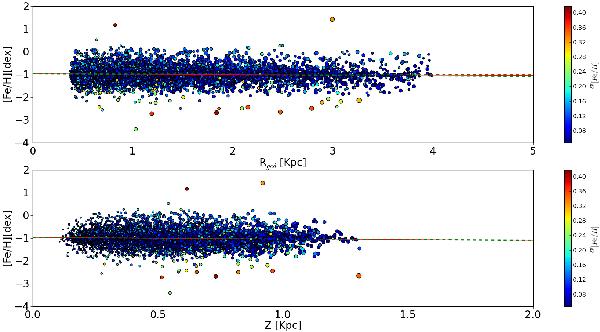
[Fe/H]-Rgcd (top panel) and [Fe/H]-Z (bottom panel) planes containg all stars in our sample. Each star is presented as a circle, where the size represents the uncertainty in the distance and the color represents the uncertainty in the metallicity. The red line represents our mean slope and the two green dashed lines represents the ±sigma region.
Current usage metrics show cumulative count of Article Views (full-text article views including HTML views, PDF and ePub downloads, according to the available data) and Abstracts Views on Vision4Press platform.
Data correspond to usage on the plateform after 2015. The current usage metrics is available 48-96 hours after online publication and is updated daily on week days.
Initial download of the metrics may take a while.