Fig. 10
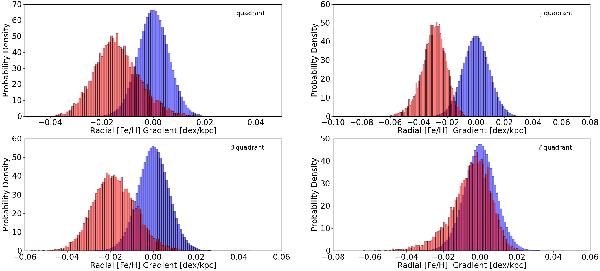
Normalized histograms for each of the galactic coordinates in red, as shown in Fig. 6 and the corresponding histograms of the permuted sample in blue. The distances between the means of the red and the blue distributions in the the quadrants α, β, γ, and δ are 2.3σ, 2.5σ, 3.2σ, and 0.61σ, respectively. The α quadrant shows the most significant gradient. If we assume a 3σ cutoff, this gradient is the only one unlikely to be explained by chance. The varying significance is due to the corresponding stellar counts, see text for details.
Current usage metrics show cumulative count of Article Views (full-text article views including HTML views, PDF and ePub downloads, according to the available data) and Abstracts Views on Vision4Press platform.
Data correspond to usage on the plateform after 2015. The current usage metrics is available 48-96 hours after online publication and is updated daily on week days.
Initial download of the metrics may take a while.