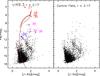
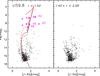
Fig. 8
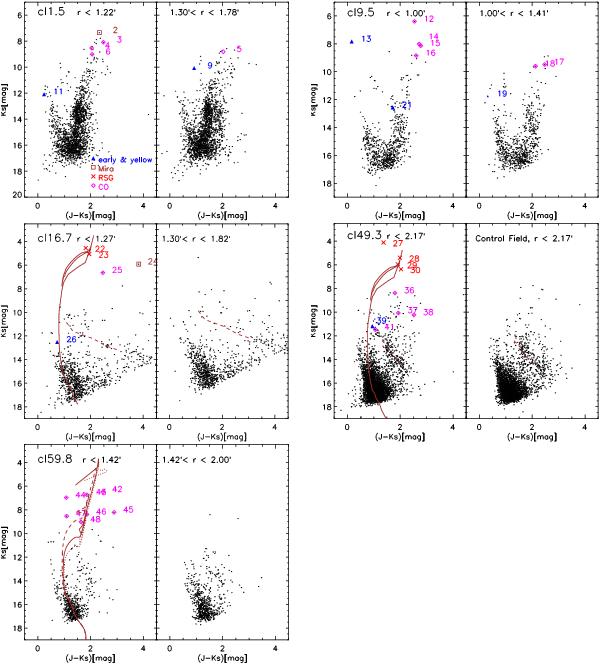
2MASS/UKIDSS J − KS versus KS CMDs: cl1.5 (top left), cl9.5 (top right), cl16.3 (middle left), cl49.3 (middle right), and cl59.8 (bottom left). Photometry was obtained with a PSF-fitting technique (see text). For each candidate cluster, a diagram of the candidate cluster is shown in the left panel, and that of a control field of equal area in the right panel. Spectroscopically detected early and yellow stars are marked with filled triangles, Miras with squares, RSGs with crosses, and red giants with diamonds; identification numbers are taken from Table 3. In the CMDs of fields cl16.3 and cl49.3, which are rich in RSGs, a continuous curve displays an isochrone of 20 Myr from Lejeune & Schaerer (2001), reddened with AKs = 0.50 mag and 0.48 mag, and shifted to DM = 12.93 mag and 14.22 mag, respectively; a dashed line shows the sequence of red clump stars (see Sect. 4.2). The CMD of cl59.8 shows three isochrones from Marigo et al. (2008) with solar metallicity and ages of 100 (dashed line), 200 (continuous line), and 300 Myr (dotted line), which were reddened (AKs = 0.55 mag) and shifted to DM = 12.9 mag.
Current usage metrics show cumulative count of Article Views (full-text article views including HTML views, PDF and ePub downloads, according to the available data) and Abstracts Views on Vision4Press platform.
Data correspond to usage on the plateform after 2015. The current usage metrics is available 48-96 hours after online publication and is updated daily on week days.
Initial download of the metrics may take a while.