Fig. 6
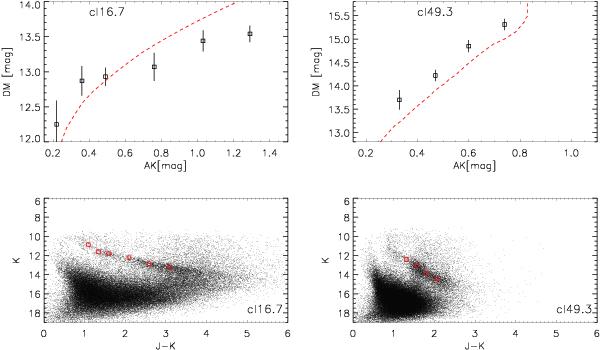
Top panels: interstellar extinction AK versus distance moduli of red clump stars in the fields of cl16.7 (left) and cl49.3 (right). As a comparison, the model of Drimmel et al. (2003) is shown with a dashed line. Bottom panels: UKIDSS J − K versus K diagram of data-points within an area of 10′× 10′ from the estimated centers of cl16.7 (left) and cl49.3 (right).
Current usage metrics show cumulative count of Article Views (full-text article views including HTML views, PDF and ePub downloads, according to the available data) and Abstracts Views on Vision4Press platform.
Data correspond to usage on the plateform after 2015. The current usage metrics is available 48-96 hours after online publication and is updated daily on week days.
Initial download of the metrics may take a while.