Fig. 7
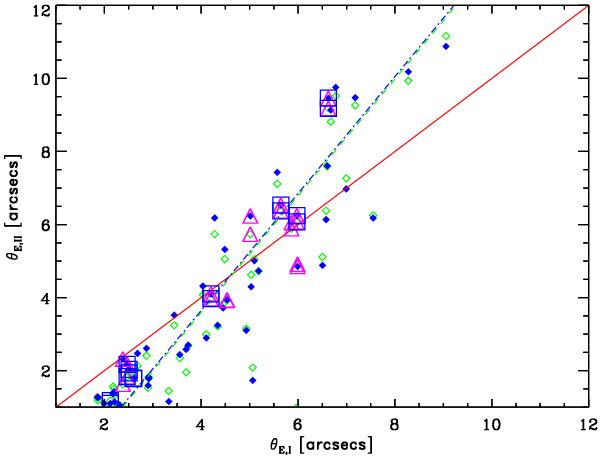
θE,II vs. θE,I. Green diamonds depict the objects used to construct the plots shown in the right column (top and middle panels) of Fig. 5. Green dashed line shows the fit to the data. Similarly, the blue filled diamonds are the objects associated with the correlations shown in the right column (top and bottom panels) of the same figure. Blue dash-dotted line shows the fit to the data. Blue squares are groups with giant arcs (see Sect. 4.1), magenta triangles are those groups with strong lensing model (see Sect. 4.3), and the red continuous line shows the one-to-one relation. The error bars are omitted for clarity.
Current usage metrics show cumulative count of Article Views (full-text article views including HTML views, PDF and ePub downloads, according to the available data) and Abstracts Views on Vision4Press platform.
Data correspond to usage on the plateform after 2015. The current usage metrics is available 48-96 hours after online publication and is updated daily on week days.
Initial download of the metrics may take a while.