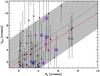
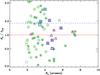
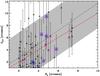
Fig. 5
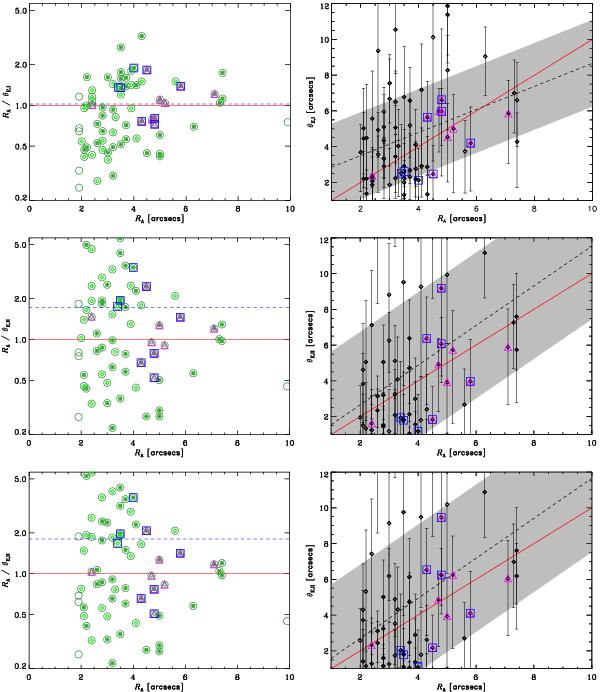
Left column: RA/θE vs. RA for the two first methods discussed in this work. Top panel: RA/θE,I vs. RA. Green circles depict the secure group candidates (Foëx et al. 2013), green diamonds those with 2.0′′ ≤ RA ≤ 8.0′′. Green filled squares are groups with multi-component features or very elongated light contours (see Sect. 5). The blue dashed line depicts the mean RA/θE,I, the red continuous line shows the one-to-one relation, blue squares are groups with giant arcs (see Sect. 4.1), and magenta triangles represent those groups with strong lensing models (see Sect. 4.3). The error bars were omitted for clarity. Middle panel: RA/θE,II vs. RA using the catalog constructed using the Vrms as proxy for the velocity dispersion measured in the observed lenses. Bottom panel: RA/θE,II vs. RA using the catalog built to match the shape of the observational redshift distribution of the lenses. Right column: θE vs. RA. Black triangles show all the groups (regular or irregular) that satisfy 2.0′′ ≤ RA ≤ 8.0′′. The black dashed line shows the fit to the data, with the 1σ-error depicted as a gray shaded region. As before, the red continuous line shows the one-to-one relation.
Current usage metrics show cumulative count of Article Views (full-text article views including HTML views, PDF and ePub downloads, according to the available data) and Abstracts Views on Vision4Press platform.
Data correspond to usage on the plateform after 2015. The current usage metrics is available 48-96 hours after online publication and is updated daily on week days.
Initial download of the metrics may take a while.